This overview of the Show Path of the SPARKvue 2 software demonstrates a reaction between an antacid tablet and vinegar while covering these specific features:
- connecting a PASPORT sensor via an interface [0:53]
- selecting a single measurement for the Show path [2:23]
- starting data collection [2:43]
- navigating between any two pages [4:56]
- scaling the graph manually and automatically with Scale to Fit [5:28]
- analyzing an entire data run with Coordinates [6:16]
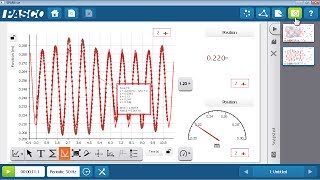
- selecting and analyzing a portion of a data run with Statistics [7:17]
- selecting and annotating a single data point [8:26]
- changing the measurement displayed in a graph [9:20]
Video Library