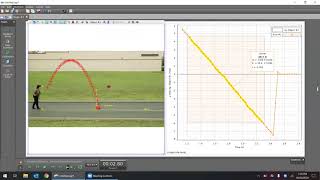
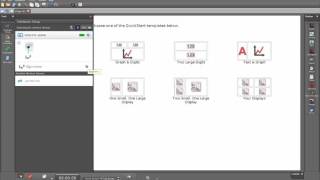
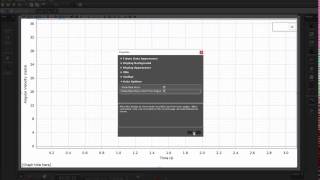
How do I draw a prediction in the PASCO Capstone graph to compare with subsequent measurements?
(Note: this video does not include any audio narration.)
Video Library
How do I draw a prediction in the PASCO Capstone graph to compare with subsequent measurements?
(Note: this video does not include any audio narration.)