
Wireless Spectrometry: Colored Solutions
The PASCO Wireless Spectrometer, paired with our intuitive Spectrometry Software makes analyzing colored solutions easier than ever!
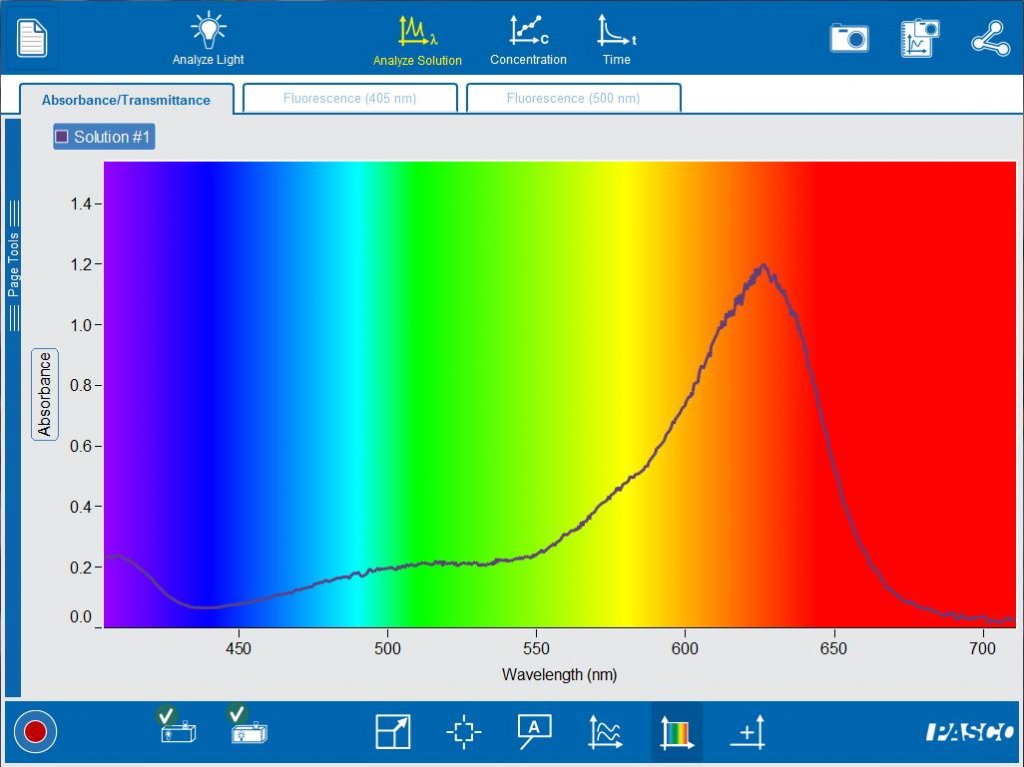
Developed specifically for student analyses in spectrometry, our free Spectrometry Software works on computers, tablets, and Chromebook. The Analyze Solution tab allows students to calibrate the Spectrometer with a blank cuvette containing the solvent. Then simply insert the solution and start recording to generate an absorbance and wavelength graph!
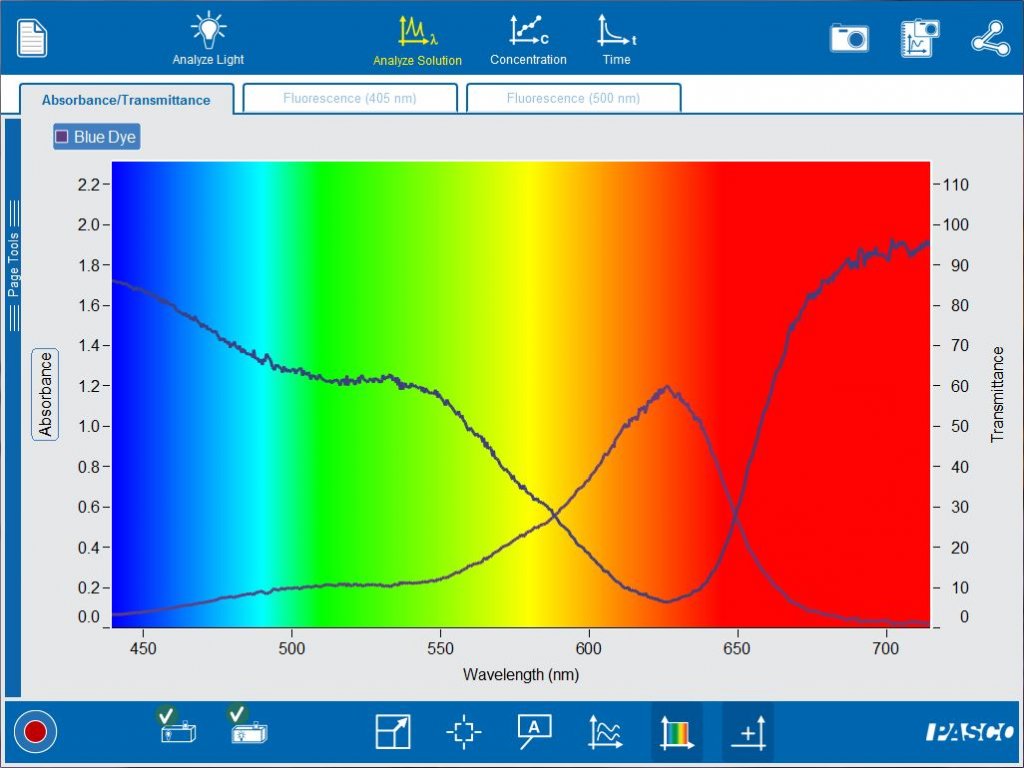
Students can easily switch between absorbance and transmittance for a solution. With one click, they can add an axis to compare absorbance and transmittance at the same time.
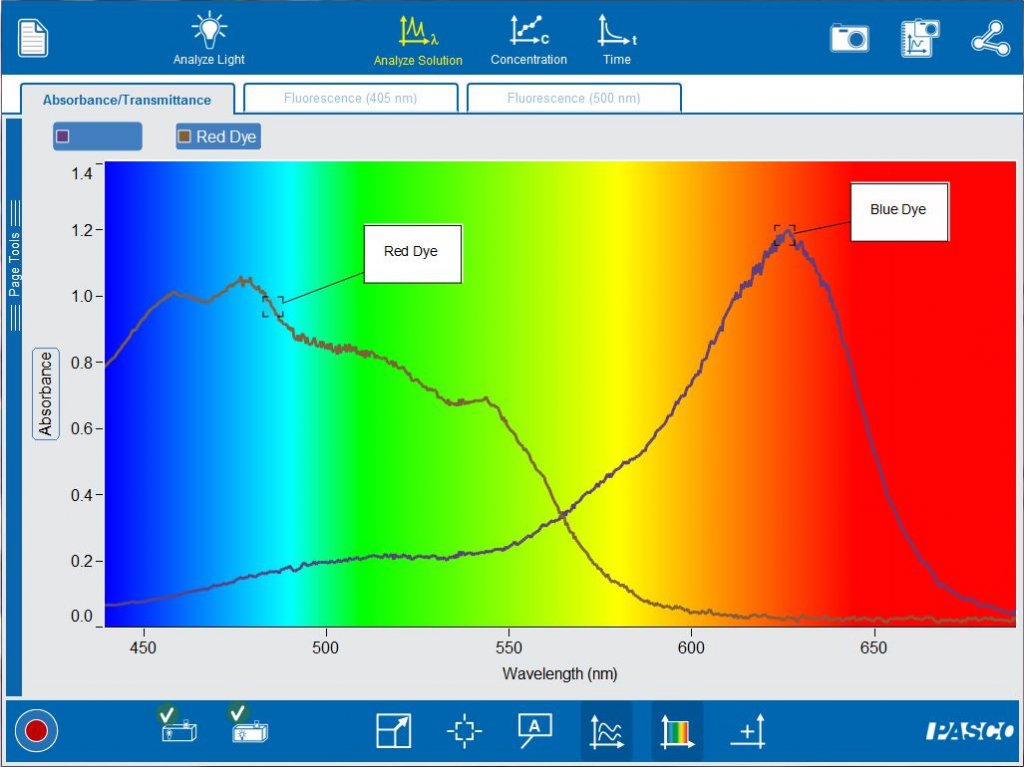
Comparing additional solutions is also easy. Simply start recording another run to get started. By comparing red and blue dyes, students will be able to make the connection between the observed color of the solution, the wavelengths of the transmitted light and the wavelengths of the absorbed light.
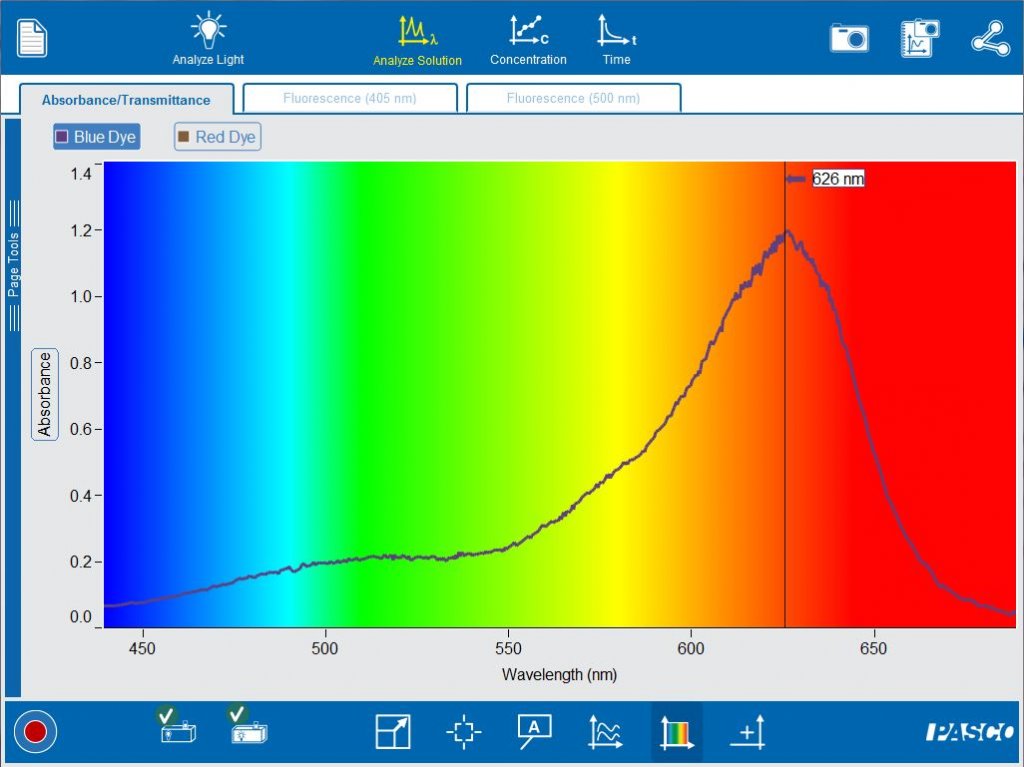
Once your students understand some of the foundations of spectrometry, they can further investigate the relationships between absorbance , concentration and time. By simply selecting the analysis wavelength on the graph, it is possible to do Beer’s law and kinetics studies of their colored solution.
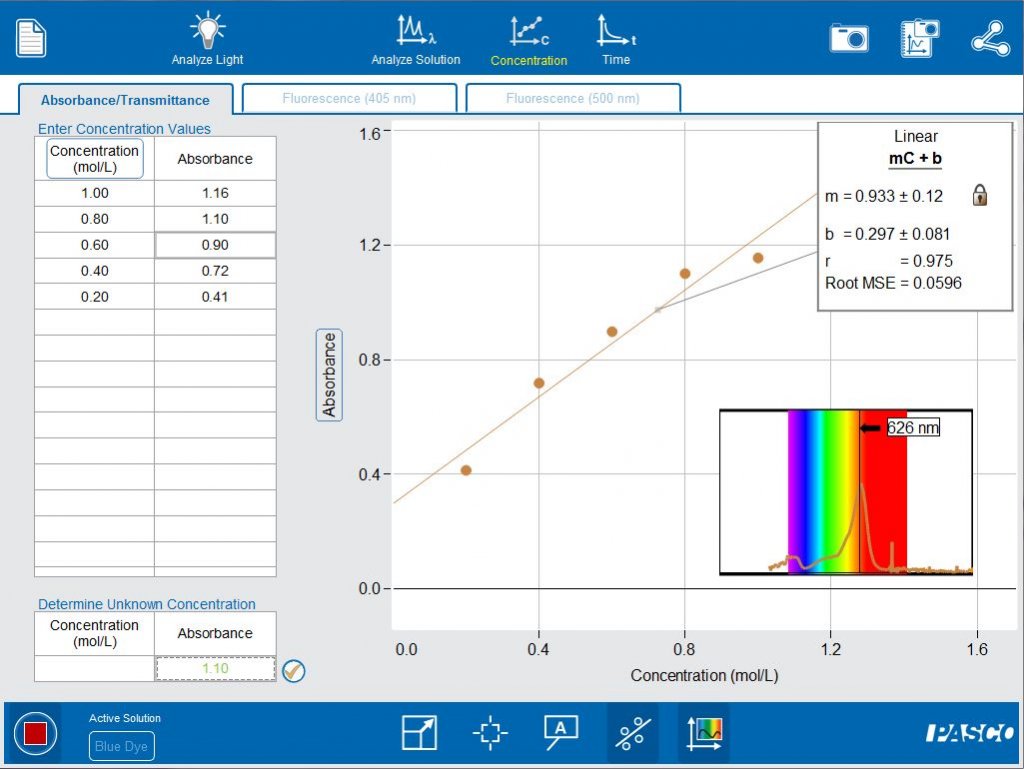
Opening the Concentration tab in the software, leads to a Beer’s lab experiment already set up for students. A calibration curve is generated is by measuring the absorbance of a set of standard colored solutions,. Students can then evaluate the concentration of an unknown sample based on the calibration curve and its absorbance.
The Kinetics tab allows students to monitor the speed of a reaction. The absorbance at the analysis wavelength can be monitored as the blue dye solution reacts with bleach (sodium hypochlorite).
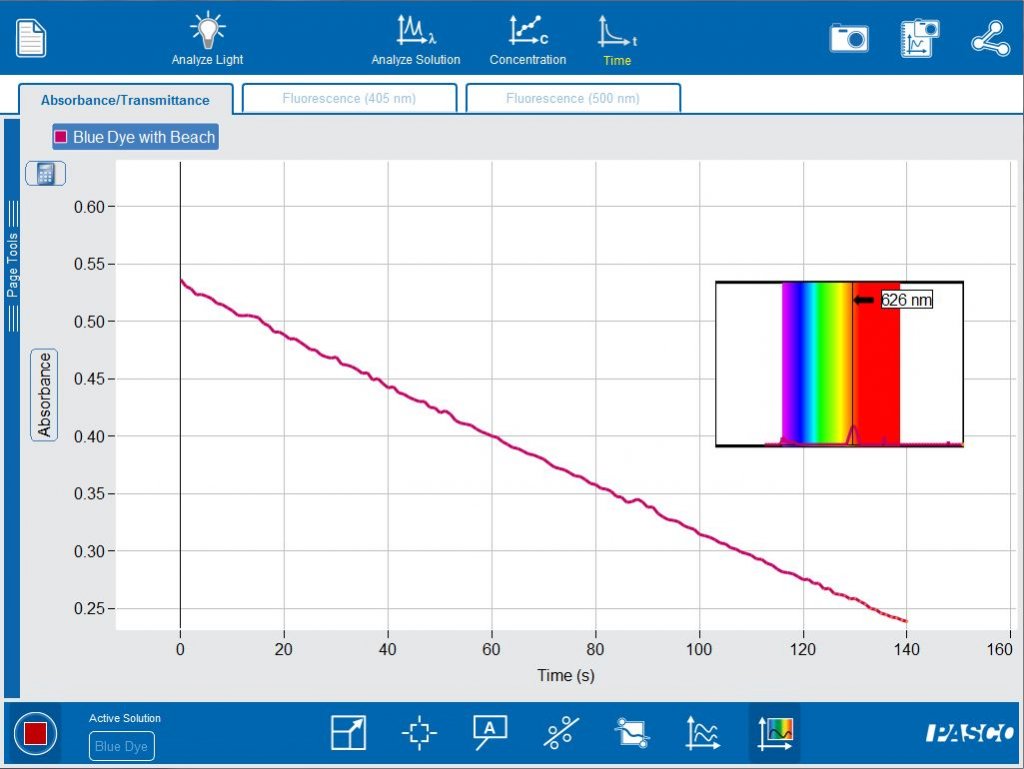
By plotting functions of concentration vs time, the order of the reaction can be determined. The software easily allows the student to switch between concentration, ln(concentration) and inverse concentration to determine if the reaction is zero, first or second order.
The PASCO Wireless spectrometer is ideally suited for any tablet or computer laboratory environment. The free Spectrometry software makes it easy for student to understand fundamental spectroscopy concepts and apply them in essential and meaningful ways.
