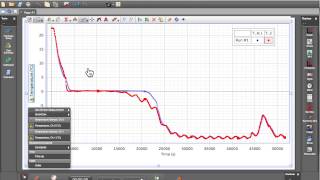
How do I plot a second type of measurement in an existing PASCO Capstone graph display?
There are two options:
1. add a second y-axis
2. add a second plot area
How do I plot a second type of measurement in an existing PASCO Capstone graph display?
There are two options:
1. add a second y-axis
2. add a second plot area