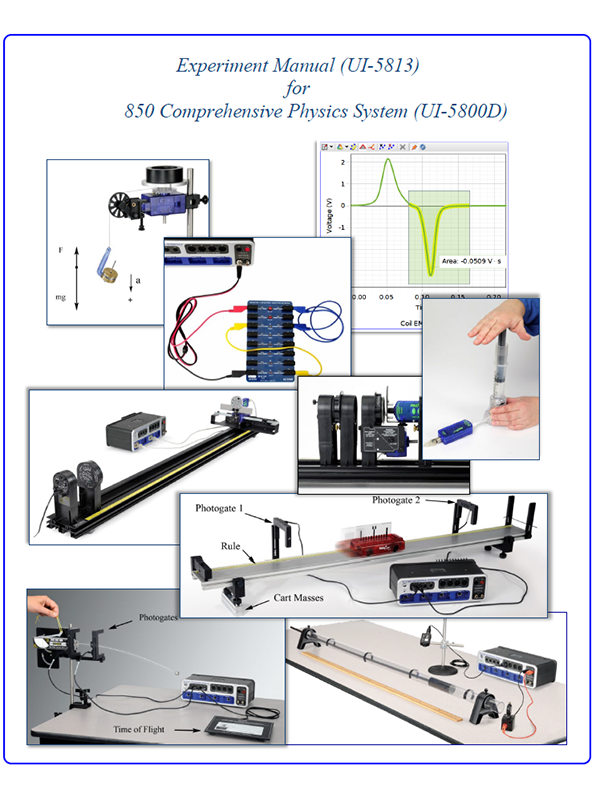
Comprehensive 850 Physics System
The following is a complete list of experiments from PASCO's Comprehensive 850 Physics System Experiment Manual. You may preview and download editable student handouts, Capstone data files, and sample images, or export files to your Google Classroom using the chalkboard icon.
Grade Level: College
Subject: Physics
Student Collection Files
| UI-5813 Lab Manual | 18.67 MB |
Teacher Collection Files
Sign In to your PASCO account to access teacher files and sample data.
Activities
01) Intro to Measurement
In this lab, students will measure the period of a simple pendulum and use scientific methods to determine the relationships between the period of a pendulum and its length, the mass of the pendulum, and the amplitude of the pendulum’s motion.
02) Uncertainty and Error Analysis
In this lab, students will learn how to estimate uncertainty for different types of measurements.
03) Relative Motion in One Dimension
In this lab, students will study motion relative to a moving reference frame.
04) Graph Matching
In this lab, students will explore plots of position and velocity vs. time. The Motion Sensor is used to detect the motion of a person moving back and forth in front of the sensor along a straight line at different speeds. The challenge is to move in such a way that a plot of the motion ‘matches’ the graph that is provided.
05) Instantaneous and Average Speed
In this lab, students will measure a cart's average speed between photogates to observe the difference between instantaneous and average speed.
06) Position and Velocity
In this lab, students will investigate the relationship between position and velocity using a Motion Sensor to measure the position of a motorized cart.
07A) Velocity and Acceleration
In this lab, students analyze graphs of position and velocity to determine constant velocity and constant acceleration.
07B) Great Race
In this lab, students will race the Fan Cart and Motorized Cart.The Fan Cart gets off to a slow start, but has a constant acceleration. The Motorized Cart has a constant speed and initially pulls out ahead. But what determines who wins the race?
08) Equations of Motion
In this lab, students will generate graphs of position and velocity for a cart accelerating down an incline. Then, they'll compare their user-defined curve fits to the standard equations of motion.
09) Acceleration Due to Gravity
In this lab, students measure the acceleration of a cart moving down an incline, then, compare their measured value to the theoretical.
10) Freefall Picket Fence
In this lab, students generate velocity vs. time graph for a picket fence free-falling through a Photogate. Then, students will use their graphs to determine the acceleration due to gravity.
11) Acceleration on an Inclined Plane
In this lab, students will study the relationship between position, velocity and acceleration of a cart as it moves up and down an inclined track.
12) Projectile Motion
Use photogates to measure time of flight and the initial launch velocity of the ball and predict the range fired at an angle off the table onto the floor. Also, find the maximum range as a function of angle.
13) Projectile against Wall
A ball is fired towards a wall at a fixed distance away. At what angle should the ball be launched so that it hits the wall at the highest location?
14) Newton's First Law
Determine how external forces affect an object's motion as summarized by Newton's 1st Law of Motion.
15) Newton's Second Law
Newton's Second Law is examined by measuring the resulting acceleration of a fan cart under two conditions: Variable force (while keeping the mass constant) and variable mass (while keeping the force constant).
16) Force and Acceleration
Investigate the relationship between the net force applied to an object and the resulting acceleration of that object. A force is applied to a low friction cart using hanging masses over a pulley.
17) Inertia and the Second Law
A force is applied directly to the cart by pulling and pushing on the attached Force Sensor. The resulting acceleration is measured by the Motion Sensor, and the analysis of a Force vs. Acceleration graph allows the concept of "inertia" to be quantified.
18) Newton's Third Law
Determine the relationship between forces forming an action-reaction pair as defined in Newton's Third Law. Two Force Sensors are used to measure the paired forces in a rubber band tug-of-war and the paired forces in a collision of two carts.
19) External Forces and the Third Law
To investigate Newton's Third Law, the forces are examined that are exerted on the two sensors by a connecting string. Also, the external force exerted by hand on an elastic cord is compared to the internal forces created by the tension in the string.
20) Atwood's Machine
Using an Atwood’s Machine, a photogate is used to measure the velocity of both masses as one moves up and the other moves down. The slope of the graph of velocity vs. time is the acceleration of the system and compensation is made for friction.
21) Acceleration up an Inclined Plane
The hanging mass is connected to the cart by a string that runs up and over the pulley. The falling mass pulls the cart up the inclined track. The speed is measured by the photogate and pulley, and the acceleration is calculated from a speed vs. time graph. The acceleration is compared to the theoretical value, and corrections are made to account for frictional forces.
22) Statics
The components of tension from the two parts of the string are compared to the Force Sensor pulling at the center of the string in a system in static equilibrium. Students sum the force vectorally.
23) Coefficients of Friction
A motorized cart is used to pull the friction trays in a controlled manner along the track, as a force sensor directly measures the frictional force. All parameters affecting the frictional force are investigated, including material, speed, normal force, and surface area.
24) Friction and Newton's Laws
Sliding friction is measured by using a photogate to measure the acceleration of a Friction Tray as it is being pulled along a horizontal track by a falling mass.
25A) Magnetic Drag
As a cart moves along an aluminum track, the magnets induce eddy currents in the track, causing magnetic drag on the cart. The magnitude of this force is measured by analyzing the deceleration of the moving cart and the relationship between the drag force and the speed of the cart is determined.
25B) Magnetic Damped Oscillations
As a cart oscillates on an aluminum track, the magnets induce eddy currents in the track, causing magnetic drag on the cart. The amount of damping is varied by changing the spacing between the magnets and the track. Systems are investigated that are under-damped, over-damped, and critically damped.
26) Air Drag
A large sail causes drag, slowing the moving cart. Three different size sails are used to study the relation between the drag force and the area of the sail. The effect of cart speed is also investigated, including the concept of terminal velocity.
27) Centripetal Force
The dependence of centripetal force on radius and angular velocity is investigated. A rigid pendulum hangs from a force sensor mounted directly onto the shaft of the Rotary Motion Sensor so both force and angular velocity are recorded the pendulum oscillates back and forth.
28) Conservation of Energy on an Inclined Track
As a cart rolls freely downhill, gravitational potential energy is converted to kinetic energy. The cart is released from the same height, multiple times, with the photogate measuring the speed at a different location for each run. Both potential and kinetic energy are measured at various heights.
29) Gravitational Potential Energy
To explore the relationship between potential and kinetic energy for a falling object, a Motion Sensor measures both the position and velocity of a falling ball. Calculations are made for gravitational potential energy and kinetic energy.
30) Conservation of Energy of a Simple Pendulum
When a pendulum swings, potential energy is transformed into kinetic energy, and then back again to potential energy as the speed and elevation of the pendulum vary during the motion. The motion is measured using a Rotary Motion Sensor.
31) Hooke's Law and Elastic Potential Energy
As the spring cart launcher is loaded, a force sensor and a motion sensor are used to measure the spring constant and the amount of potential energy stored in the compressed spring. Then cart is launched and its final kinetic energy is measured and compared to the stored energy in the spring.
32) Work-Energy Theorem
A force sensor is used to measure the changing force applied by a stretched elastic cord, while a motion sensor records the resulting velocity of the cart. The work done by the elastic cord is compared to the increase in kinetic energy.
33) Collisions in One Dimension
Elastic and inelastic collisions are performed with two dynamics carts of different masses. Magnetic bumpers are used in the elastic collision and Velcro® bumpers are used in the completely inelastic collision. Both the momentum and kinetic energy are examined before and after the collisions.
34) Impulse and Momentum
The relationship between momentum, force, and impulse is explored when a cart collides with a Force Sensor equipped with either a spring bumper, clay bumper, or magnetic bumper.
35) Ballistic Pendulum
A Ballistic Pendulum is used to determine the muzzle velocity of a ball shot out of a Projectile Launcher. The laws of conservation of momentum and conservation of energy are used to derive the equation for the muzzle velocity.
36) Newton's Second Law for Rotation
A torque is applied to point masses on a rod mounted on a Rotary Motion Sensor and the resulting angular acceleration is measured and the rotational inertia of the object is calculated. The radius of rotation of the point masses is varied.
37) Rotational Inertia
A known torque is applied to the three-step pulley on the Rotary Motion Sensor, causing a disk and ring to rotate. The resulting angular acceleration is measured using the slope of a graph of angular velocity versus time. The rotational inertia of the disk and ring combination is calculated from the torque and the angular acceleration. The procedure is repeated for the disk alone to find the rotational inertia of the ring and disk separately.
38) Rotational Kinetic Energy
This lab investigates the potential and kinetic energies for a modified Atwood's Machine, where a disk has been added to the Rotary Motion Sensor pulley.
39) Conservation of Angular Momentum
A disk is dropped onto a rotating disk. The initial angular momentum is compared to the final angular momentum, and the initial kinetic energy is compared to the final kinetic energy.
40) Static Equilibrium of a Rigid Body
A rod mounted on a Rotary Motion Sensor is suspended in static equilibrium. The angles, lever arms, and forces are measured. The forces are summed and the torques are summed.
41) Spring and Mass Oscillations
A Motion Sensor measures the position of the oscillating mass, and the Force Sensor is used to determine the spring constant. The period of oscillation is measured, and compared to the theoretical value.
42) Oscillation of Cart and Spring
For a spring and cart system, the effect on the period is investigated when changing the spring constant, amplitude of the oscillation, and the mass of the cart.
43) Oscillation Equations of Motion
The motion of an oscillating mass is measured using a Motion Sensor, and graphs are produced of position, velocity and acceleration. The relative phase of each is examined, and compared to theory. Calculations are made for the maximum velocity and maximum acceleration during an oscillation and the equation of motion is written for this system.
44) Driven Oscillation of Mass and Spring
The String Vibrator is used to drive the mass and spring, and the resulting oscillation is recorded using the Motion Sensor. The driving frequency is varied to observe the response above, below and at the resonance frequency of the system.
45) Physical Pendulum
A rod and a disk oscillate as a physical pendulum. The periods are measured directly by the Rotary Motion Sensor, and the values are compared to the theoretical periods calculated from the dimensions of the pendula.
46) Large Amplitude Pendulum
Explore the oscillatory motion of a physical pendulum for both small and large amplitudes and discover the dependence of the period of a pendulum on its amplitude. Waveforms are examined for angular displacement, velocity and acceleration.
47) Variable-g Pendulum
A pendulum is constrained to oscillate in a plane tilted at an angle from the vertical. This effectively reduces the acceleration due to gravity because the restoring force is decreased. The Acceleration Sensor is fastened to the Rotary Motion Sensor, and directly measures the effective "g" for the pendulum.
48) Physical Pendulum Minimum Period
The period of a physical pendulum is measured with its mass in various positions. Starting with the mass furthest from the pivot gives a long period. However, if you move the mass up close to the pivot, the period will be very long, due to the fact the pendulum is almost balanced by the upper fixed mass. Somewhere in between these two extremes, the period goes through a minimum value.
49) Archimedes' Principle
The buoyant force on several objects is measured by taking the difference between the object's weight in air, and its apparent weight in water. This measured buoyant force is compared to the theoretical value calculated using the object's volume and Archimedes' Principle.
50) Heat and Temperature
Explore the relationship between heat and temperature by measuring the amount of temperature change in two different volumes of the same fluid, subject to the same amount of added thermal energy.
51) Transfer of Heat by Radiation
Explore how heat energy is lost by a hot object and show how radiation is affected by the different surfaces of a hot object.
52) Specific Heat
Use a temperature sensor to measure the temperature change of a volume of warm water when a cold piece of metal is placed in it. Determine the total amount of heat transferred from the warmer water to the cold metal, and the specific heat of the metal sample.
53) Electrical Equivalent of Heat
Determine the amount of electrical energy (in Joules) that is equivalent to a certain amount of thermal energy (in calories) by measuring the amount of electrical energy used in the heating resistor to heat water and the resulting thermal energy added to the water.
54) Boyle's Law
Rediscover Boyle's Law by holding the temperature of a gas constant and changing the volume of the gas, and measuring the volume and the absolute pressure.
55) Absolute Zero
A constant-volume gas thermometer is used to determine the value of absolute zero in degrees Celsius by plotting Temperature vs. Absolute Pressure and finding the temperature at which the Absolute Pressure is zero.
56) Sound Waves
Explore the characteristics of different sounds, the waves that produce sounds, and the fundamentals of frequency and harmonics within different sounds.
57) Standing Waves on a String
Examine how the amount of tension required to produce a standing wave in a vibrating string of fixed length and mass density is affected by the wavelength and the frequency of the wave. This is a hands-on experiment where the student gets to feel the force required to increase the number of vibrating segments.
58) Resonance Air Column
A sine wave generator drives an open speaker to create a standing sound wave in a resonance tube. The driving frequency and the length of the tube are varied to study their relationship to wavelength and the speed of the sound wave. The concepts of nodes, anti-nodes, and harmonics are investigated for both closed and open tubes.
59) Speed of Sound in Air
Measure the speed of sound in air using a tube that is closed at one end. Use a Sound Sensor to record the initial pulse of sound and its echo. Calculate the speed of sound based on the overall distance traveled and the round-trip time.
60) Superposition of Sound Waves
Two waves and their sum are created in the Capstone calculator and the effects of changing phases and amplitudes are examined in a graph.
61) Interference of Sound Waves
Measure and analyze the behavior of two sounds that combine to produce beats. Determine the relationship between the beat frequency and the frequencies of the two interfering sound waves.
62) Shadow and Color in Light
Use the Color Mixer to learn how three colors of light - red, blue, and green - add together to create a full range of colors. Examine how color filters work and make colored shadows.
63) Object and Image Distances Thin Lens
Determine the relationship between object distance and image distance for a thin convex lens. Use a light source, optics bench, lens, and viewing screen to measure object distance, image distance, and image size.
64B) Refraction
Use Snell’s Law of refraction to experimentally determine the index of refraction of a D-shaped acrylic lens.
64C) Dispersion
Observe dispersion through an acrylic rhomboid and calculate the different indices or refraction for different colors of light.
65) Focal Length of a Concave Mirror
Use a light source, concave mirror, and half screen accessory on an optics bench to measure the focal length of the concave mirror.
66) Telescope and Microscope
Construct a simple telescope and a simple microscope and to measure their magnifications. Biconvex thin lenses will be used as the primary and eyepiece lenses. A viewing screen covered with a reference grid on an optics bench will be used to make measurements.
67) Variation of Light Intensity
Compare the variation in intensity of light from different light sources. Use a light sensor to record and compare incandescent versus fluorescent light sources, as well as light from AC versus DC sources.
68) Light Intensity vs. Distance
The relative light intensity versus distance from a point light source is plotted and compared to theory.
69) Polarization of Light
The plot of light intensity versus angle between two polarizers is fitted to the square of the cosine of the angle, verifying the Law of Malus.
70) Brewster's Angle
Explore how the intensity and polarization of light changes when reflected from the surface of a transparent medium, and then compare the experimental results to a theoretical value known as Brewster's Angle.
71) Interference and Diffraction
Diffraction and interference patterns are measured for single and double slits by scanning the laser pattern with a light sensor and plotting light intensity versus distance. Differences and similarities between interference and diffraction patterns are examined, including the effect of changing the wavelength of the light.
72) Electrostatic Charges
Compare and contrast the results of three different methods of charging: (1) rubbing two objects together; (2) touching a charged object to a neutral one; and (3) grounding a neutral object while it is polarized (charging by induction). Investigate how charge distributes on the outer surfaces of a spherical conductor and a non-spherical conductor.
73) Electric Field Mapping
This qualitative activity introduces the concepts of equipotential surfaces and electric fields. A number of rules about the electric field are verified. At the end of the activity, the student should be able to sketch the electric field around a simple charge distribution.
74) Ohm's Law
Verify Ohm’s Law for commercially manufactured resistors and to examine the limits of validity for Ohm’s Law. The behavior of resistors, a diode, and a light bulb are examined.
75) Series Parallel Circuits
Series/Parallel circuits are reduced to an equivalent resistance and that resistance is verified by measuring the total current and total voltage. Also, the behavior of lamps in series, parallel, and series/parallel is qualitatively examined.
76) Kirchhoff's Circuit Laws
Verify the laws for a resistive circuit using a DC input and for a time varying RC circuit. The DC portion and the RC portion of the lab are each stand-alone labs.
77) Capacitance
Investigate how the capacitance of a parallel-plate capacitor varies when the plate separation is changed and to qualitatively see the effect of introducing a dielectric material between the plates. A computer model of the system will be developed.
78) RC Circuit
For a capacitor discharging through a resistor, the half-life for the decay is measured directly and also calculated using the capacitive time constant.
79A) LRC Series Circuit
The phase differences between the output voltage, the voltage across the inductor, the voltage across the capacitor, and the voltage across the resistor will be examined at resonant frequency, and the half-power frequencies above and below resonance.
79B) LRC Resonance
The current through a series LRC circuit is examined as a function of applied frequency and the effects of changing the values of the resistance, inductance, and capacitance are observed. The phase difference between the applied voltage and the current is measured below resonance, at resonance, and above resonance.
80) Properties of Diodes
Investigate the characteristic curves (I vs. V) of various types of diodes and to determine their “turn-on” voltages.
81) Build a Rectifier
Build a half wave rectifier and to examine its properties. An RC filter circuit is then added to produce a DC power supply and the dependence on the RC values is examined.
84) Earth's Magnetic Field
The magnitude and direction of the Earth's magnetic field are measured using a Magnetic Field Sensor mounted on a Rotary Motion Sensor.
85) Magnetic Field Mapping
Visualize the magnetic field by using small compasses to trace magnetic field lines for a dipole, a repulsive dipole, and a quadrupole field.
86) Induction: Magnet through a Coil
Examine Faraday's Law of Induction: A magnet is dropped through a coil and the voltage across the coil graphed as a function of time. The total integrated flux as the magnet moves into the coil will be compared to the flux as it moves out of the coil.
87) Magnetic Field in a Current Carrying Coil
The radial and axial magnetic fields of a current carrying coil are plotted versus position as the Magnetic Field Sensor is passed through the coil. The experimental results are compared to the theoretical model.