Visualizing Data in Google Earth
It’s easy to geo-tag data in the field using the GPS Sensor. We already covered bringing data into ArcGIS online, and exporting data for Google Earth is as easy as 1-2-3.
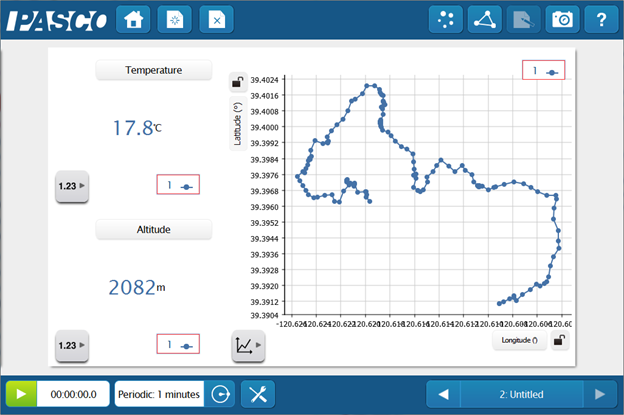
1. Collect your data using a GPS Sensor.
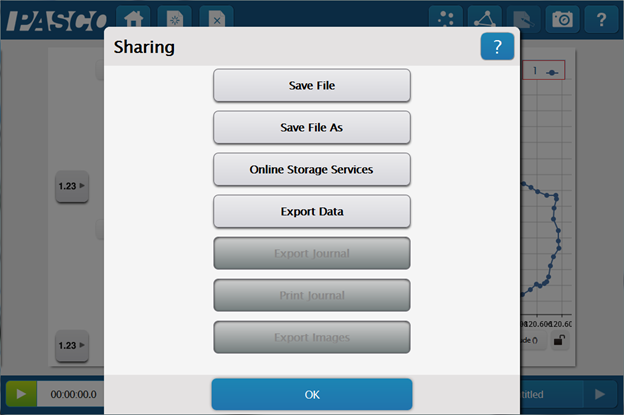
2. Export the data to a KML file.
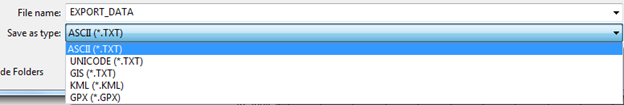
3. Open the file in Google Earth or in Google Maps online.

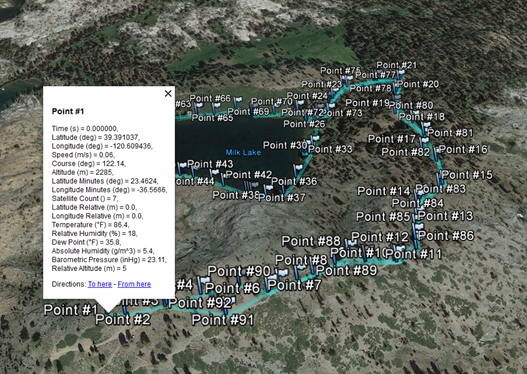
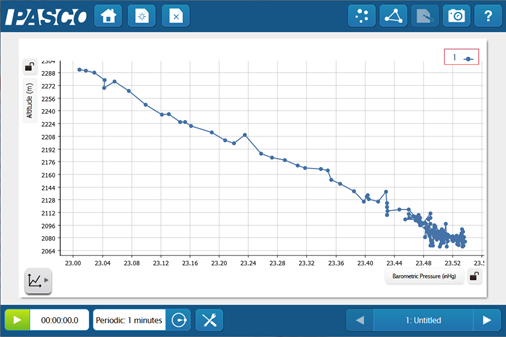
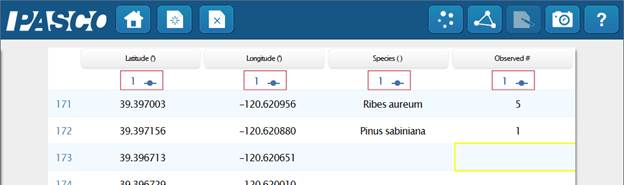
In the example above, some weather data was collected during a hike in the Sierra Nevadas. There’s much more you can do with the GPS Sensor to enhance the field learning experience. Students can use the sensor with user entered data to conduct plot studies with a data table.
With the data from this hike, students could also investigate the relationship between environmental variables and changes in altitude. The shift in biomes and ecosystems as altitude increases is often similar to increasing latitude. A field trip into the hills is a great way to capture a lot of biodiversity in a relatively small geographic area. Some data below shows Temperature vs. Altitude and may help explain changes in the types of plants.