
Titrations … not just pH anymore!
Acids and bases are a key component of any chemistry curriculum, and titrations are the most common experimental technique for analyzing these types of solutions. Many titrations involve the use of indicators, like phenolphthalein, methyl red, or bromothymol blue, that change color as the reaction proceeds.
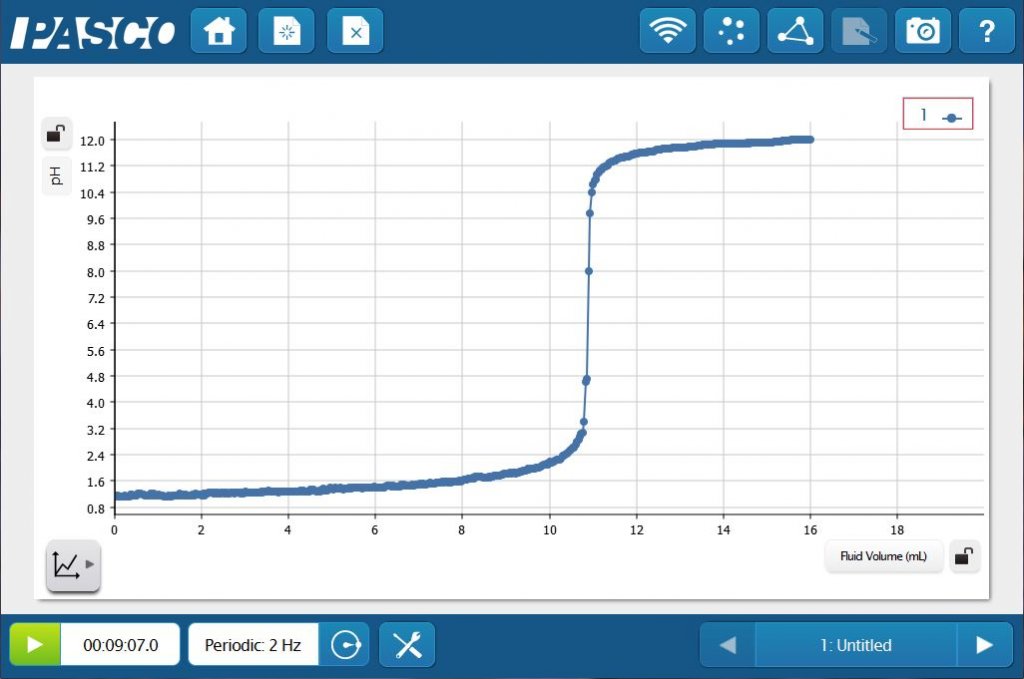
For more in-depth studies, students can use an indicator with a pH Sensor and a Drop Counter to monitor the progress of the titration. They will be able to see the indicator change color as the pH jumps at the equivalence point of the reaction. Students will also be able to create and analyze the classic HCl - NaOH titration curve in real time!
But titrations need not be limited to pH. Any property of the solution that can be monitored and will change at the equivalence point can be used for a titration.
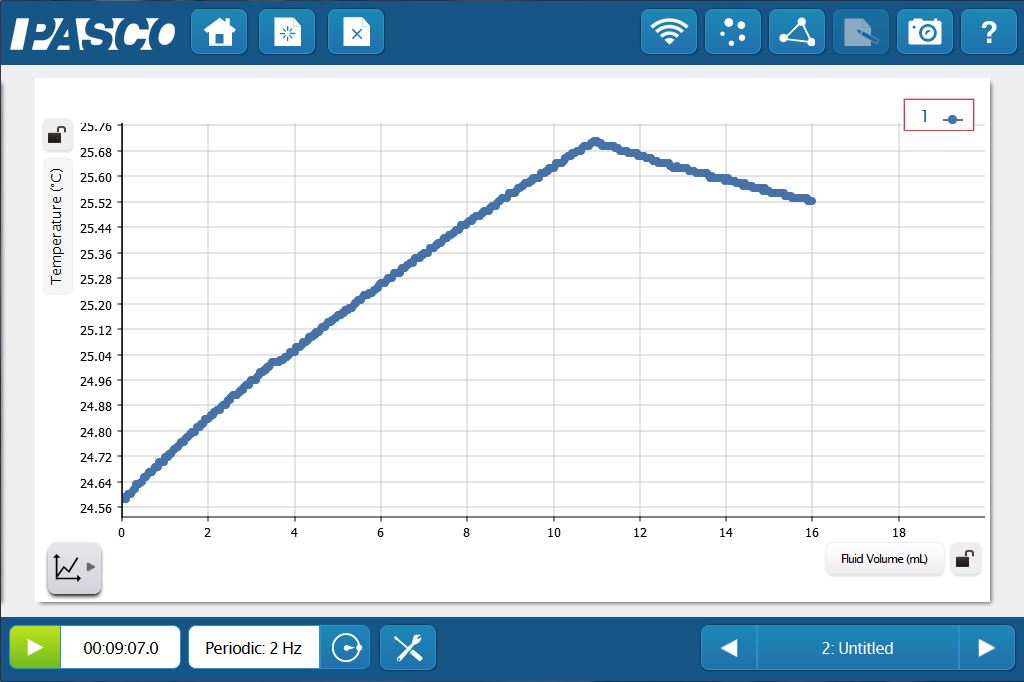
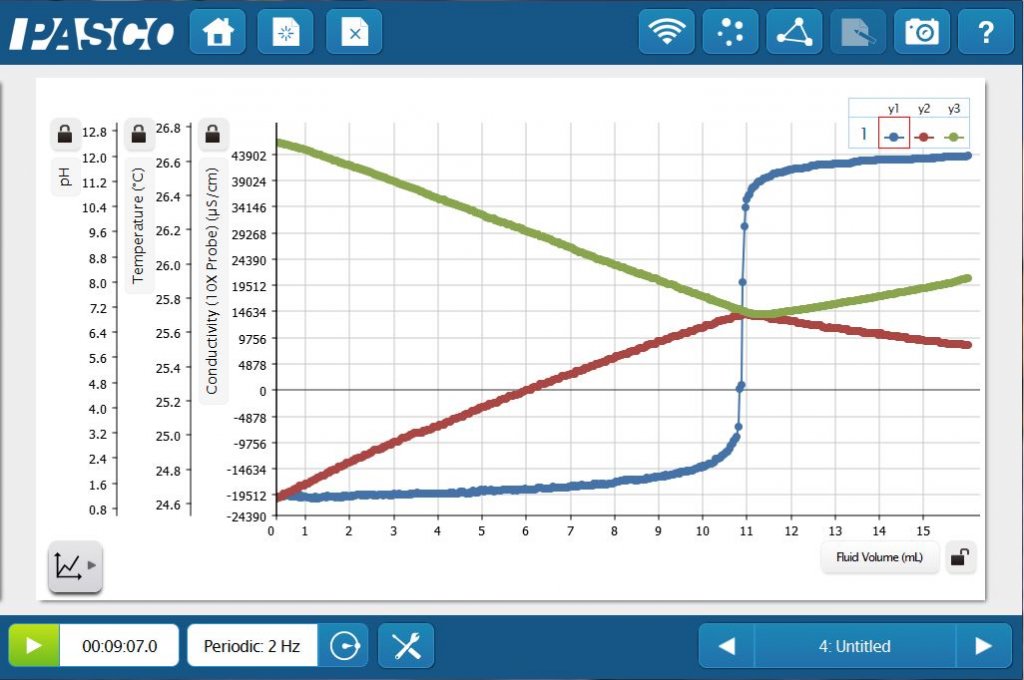
For example, the reaction between HCl and NaOH is exothermic. The overall temperature change is small, but measurable, especially with a Fast Response Temperature Probe. This change in temperature provides a great opportunity to perform a thermometric titration. The temperature will increase as long as the reaction continues, then decreases as excess titrant is added.
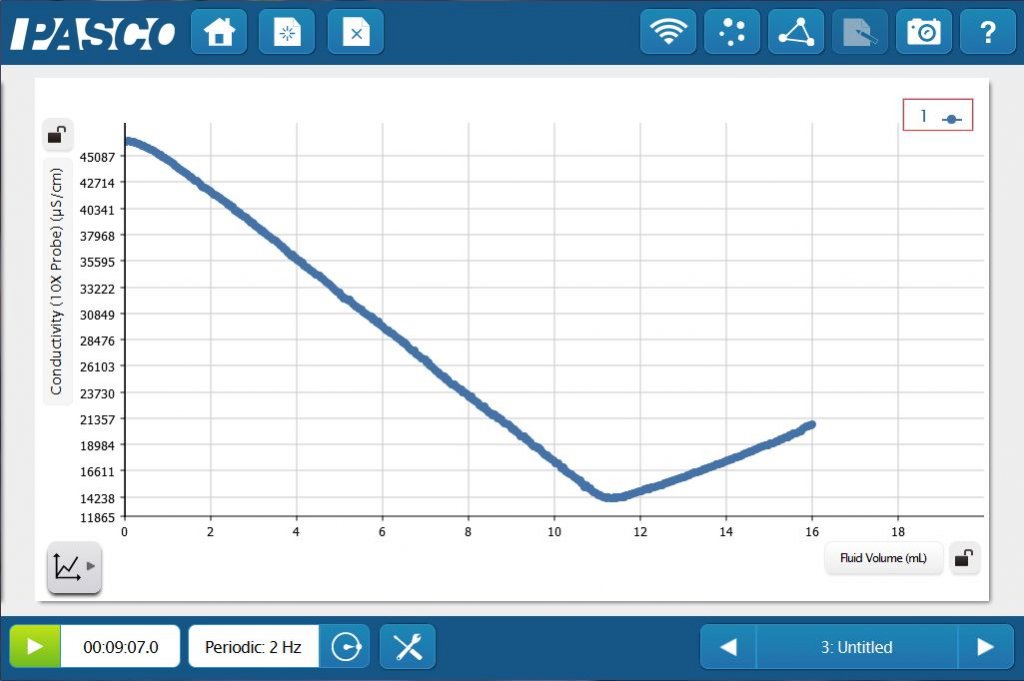
HCl and NaOH are strong acids and bases, meaning they are strong electrolytes, so a conductometric titration can also be performed. The conductivity decreases as the NaOH is titrated into the HCl to form water. Once past the equivalence point, excess NaOH titrant will once again increase the conductivity.
With pH, temperature, conductivity (and pressure) ports, the Advanced Chemistry Sensor allows you to perform all of these titration in one solution — simultaneously! By using SPARKvue® software with the Advanced Chemistry Sensor and Drop Counter, students can create pH, thermometric, and conductometric titration curves on one graph.
With this simple experiment, students will be able to connect core concepts such as acids and bases, thermochemistry, and electrolytes. Data collection and analysis tools allow them to construct and explore the big ideas and science practices that cut across your chemistry curriculum!


