The Solar Spectrum
One great way to kick off the school year is with some fun and creative lessons that make students think about the science that’s all around them. And why not take advantage of the weather and conduct an outdoor lab? One of my favorite activities to get students outdoors and thinking about science is having them analyze the solar spectrum. This activity really engages students because it involves color, astronomy, and doing a lab outside of the classroom!
I was working with my students before a wireless spectrometer was available, so my equipment was limited to spectrometers made from diffraction gratings and cardboard. First we would observe the spectra from an incandescent lightbulb, which would produce a full color spectrum. We would then go outside to view the solar spectrum as a comparison. To keep things safe, we would point the spectrometer at a white card reflecting the sunlight. The students would find that the sun showed a spectrum very similar to the lightbulb, except there were some dark lines present.

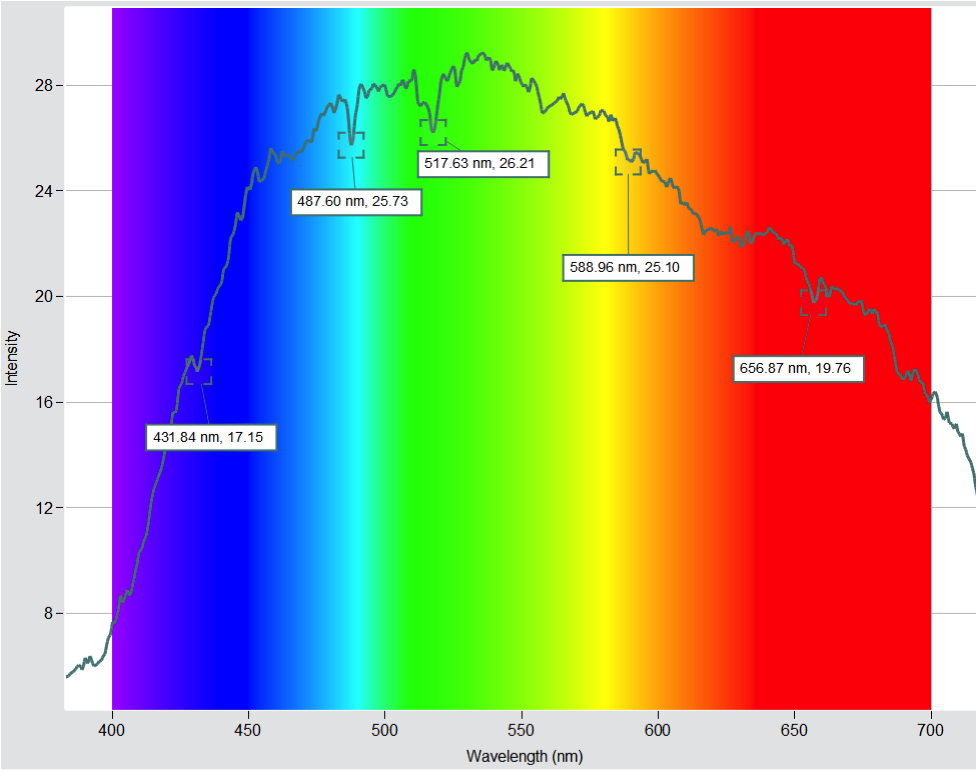
The dark lines we saw were not quite as sharp as the ones shown here, but students were usually able to identify around five dark lines and measure the wavelength of these lines. We would then go back in the classroom and compare these lines to the spectra produced from some gas discharge tubes.
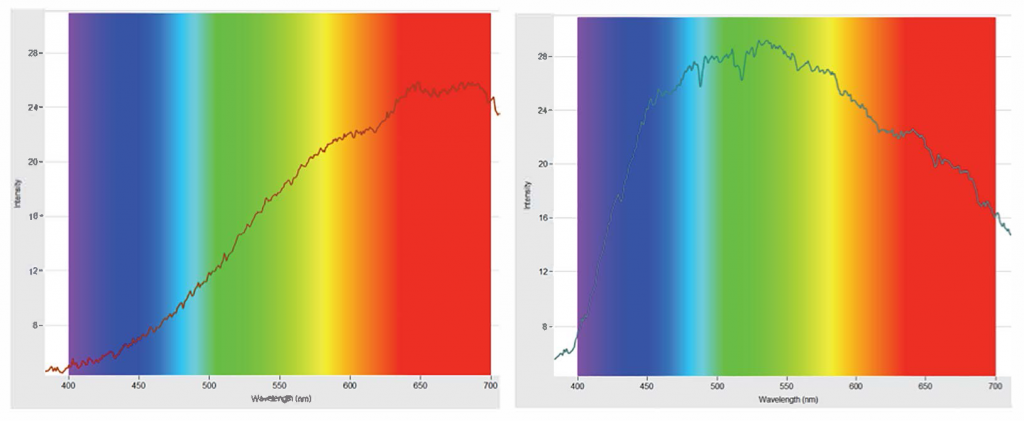
With PASCO’s Wireless Spectrometer activity, you can now quantify and analyze the data well beyond what’s possible with diffraction gratings. Recently I used the Wireless Spectrometer to compare the visible spectrum of an incandescent bulb with that of the sun.

As you can see, there are some noticeable dips where the dark lines would be present. You’ll also notice the peak is shifted toward the green region of the spectrum. This can lead to an interesting discussion on why our eyes are most sensitive to yellow-green.
Using the tools in the free Spectrometry software, I was able to determine the wavelengths of some of the prominent dips.

It is pretty easy to match the dips at 487.60 nm and 656.87 nm with hydrogen (486.13 nm and 656.28 are the actual values). Another interesting dip is at 588.96, which may be attributed to helium (587.56 nm). This was one of the dark lines my students were able to identify and match with our helium gas discharge tube. (I remember being amazed when I found out that helium was first discovered by analyzing the solar spectrum!)
Next time you’re using your Wireless Spectrometer to analyze spectra from gases, consider taking your students outside to analyze our ultimate light source!

