The Reason for Seasons
Trees are shedding their leaves and the days are getting shorter (in the northern hemisphere), so it’s the perfect time for students explore the reason for the seasons. Students often have the misconception that the distance from the sun is the main factor for the change in season. If that were the case, then the Northern and Southern Hemispheres would have the same seasons at the same time of the year, when in fact they are opposite.
Enlighten your students by modeling the movement of the Earth with some simple items. The setup pictured below includes a lamp to model the sun, a globe, a Wireless Light Sensor adhered to the globe with Velcro, and a meter stick to address those pesky misconceptions.
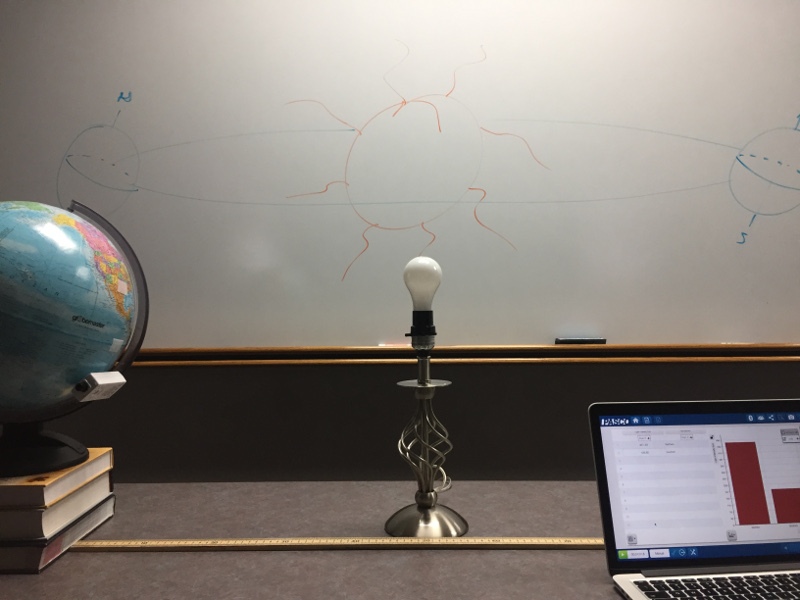
First we can look at the January in the Norther Hemisphere. Students should note the latitude and measure the light intensity using SPARKvue.
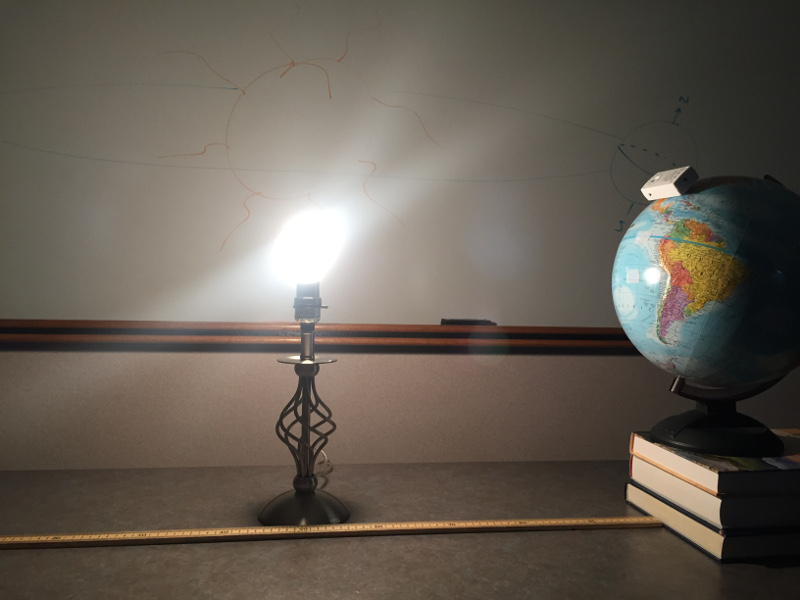
Then adhere the Wireless Light Sensor to the Southern Hemisphere at the same latitude as before, but well below the equator to measure the light intensity there.
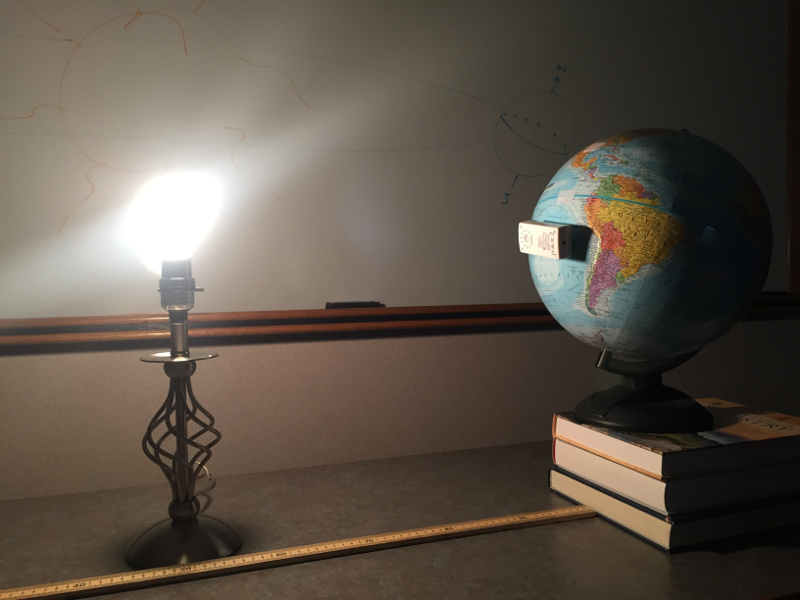
The “brighter” students in the class will notice that tilt of the Earth has greatly affected the angle of the sensor relative to the lamp. Does the angle of incidence also affect the intensity of the light? The debate may be intense, but let students create a hypothesis before they collect data, then check the data to find out!
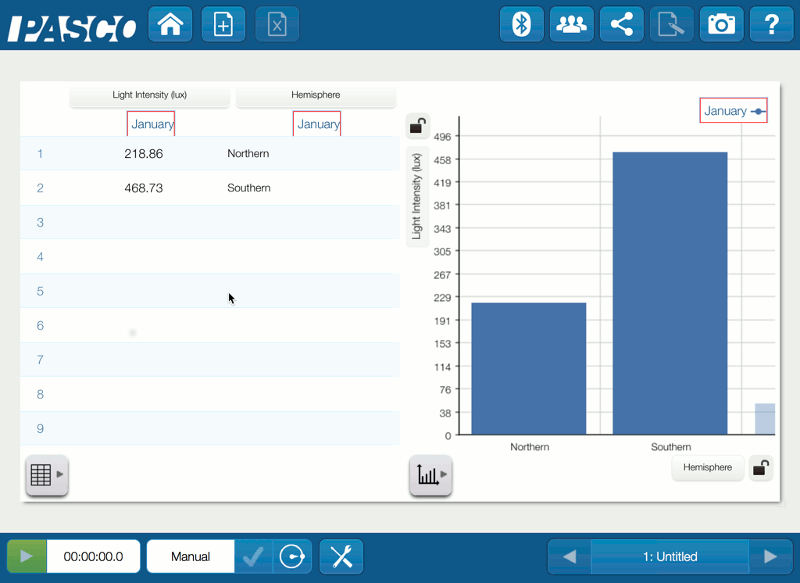
With the Earth is at this angle, there is a lot more light coming into the Southern Hemisphere. The amount of light that hits the an area on surface of the Earth is called insolation. The tilt of the Earth affects the solar insolation which is the reason we need insulation for the winter in the norther hemisphere while the Southern Hemisphere experiences summer. For students who assumed the seasons were based on the distance from the sun, this is truly a light bulb moment!
What is happening when the Earth is half-way around its orbit? No need to wait six months, we can fast forward to July simply by moving the globe to the other side of the lamp. Use the meter stick to make sure the globe is equidistant from the “sun” and affix the Wireless Light Sensor to the Northern Hemisphere.
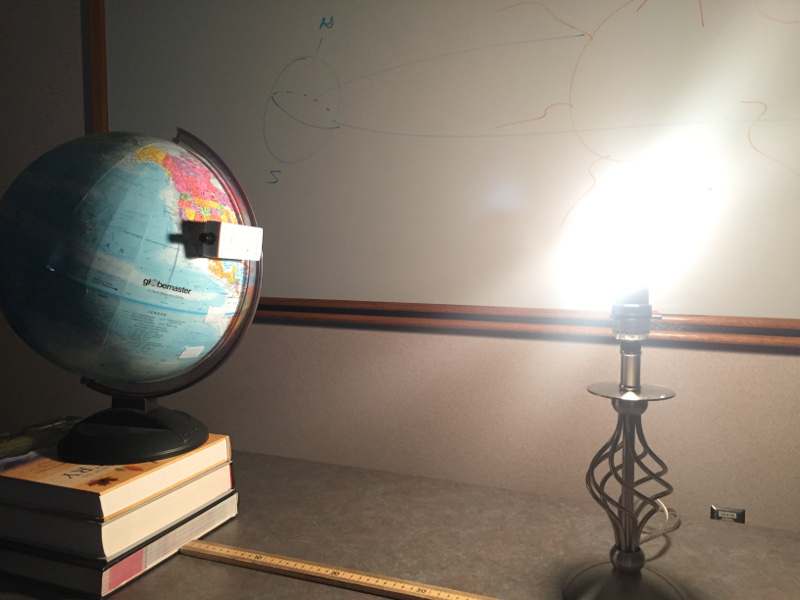
The tilt of the Earth hasn’t changed, but now the Northern Hemisphere is pointing more directly toward the lamp. Next we can move the sensor to the southern hemisphere to see if it is still as dazzling as before.
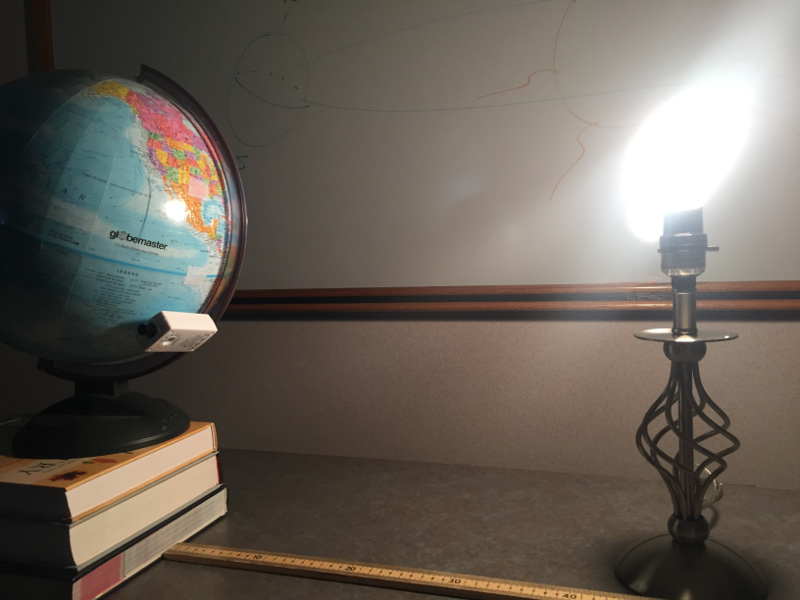
We can illuminate the effect by once again checking the data.
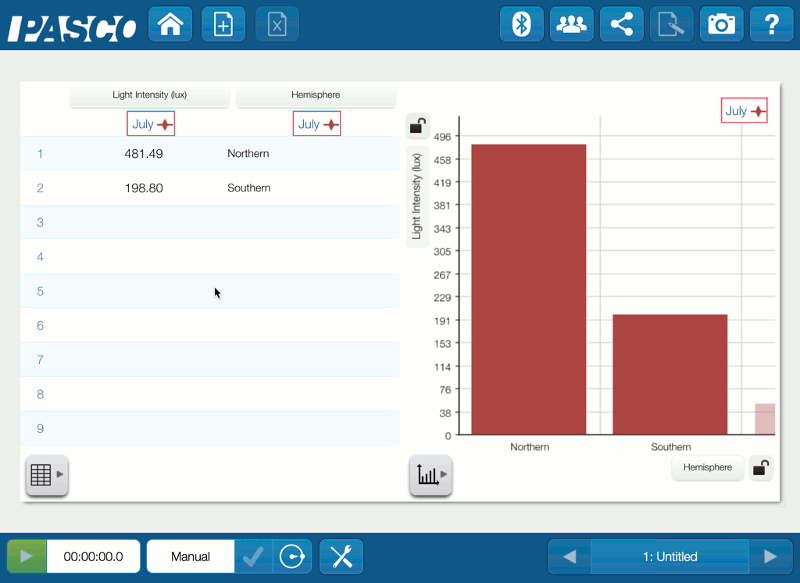
The light intensities have flipped from the previous run as the angle of incidence has changed. Now the Northern Hemisphere basks in the sun, while the Southern Hemisphere needs some insulation due to a lack of insolation.
Using SPARKvue software we can get a year in review by comparing the data.
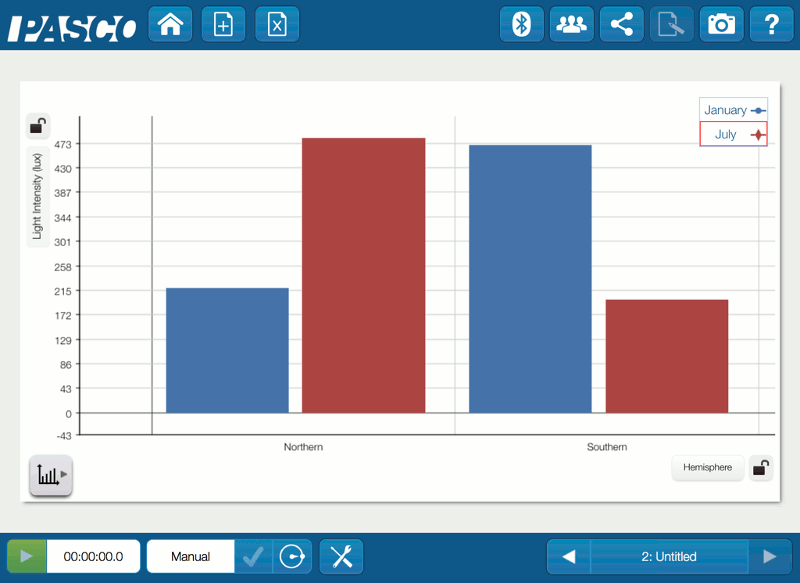
Throughout this brilliant activity, student should see that the amount of light hitting the Earth’s surface at different parts of the year is based on the tilt of the Earth about its axis, not the distance from the sun. Hopefully, this activity has shed some light on the true reason for the seasons.


