
Rainbow in a U-Tube - Electrolysis
Are you introducing your students to electrochemistry and electrolysis? Make it a colorful lesson by creating a rainbow in a U-tube! Incorporate the Voltage/Current Sensor and not only will you have an engaging demo, you will also be able to connect meaningful data to a core chemistry concept.
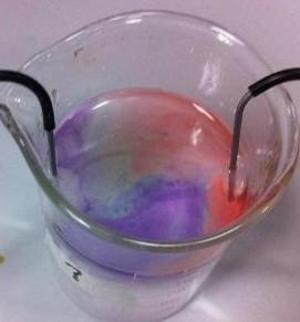
A typical electrochemistry teacher demonstration involves the electrolysis of water. Add a couple of electrodes to a beaker of water (and potassium sulfate for conductivity), then connect the electrodes to a power supply. Soon your students will observe the bubbles of hydrogen and oxygen being generated.
The overall reaction is:
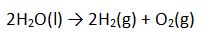
But there is more going on than just a decomposition of water to produce hydrogen and oxygen. If you add a couple of drops of Universal Indicator to the water that you are electrolyzing, your student will see that there are acids and bases being generated as well.
The half reactions are:
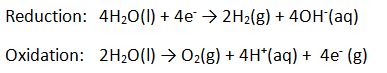
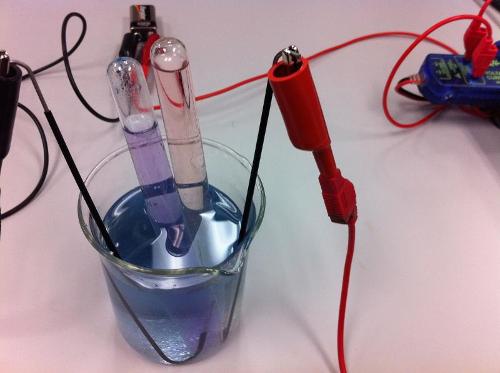
If you really want to get the point across that there are separate reactions, try the electrolysis in a U-tube. In a beaker prepare a solution of water with potassium sulfate (for conductivity) and some universal indicator. Pour the solution into a U-tube and place one electrode into each of the open ends. Finally, connect the electrodes to a power supply.
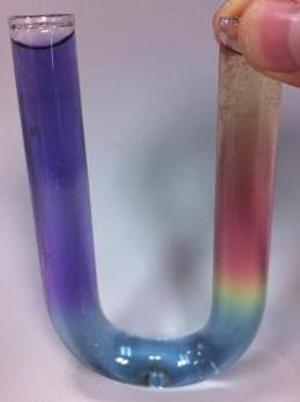
You have now just created an “Rainbow in a U-tube” via electrolysis. The demonstration is fun and engaging, but it really becomes meaningful if you start to quantify the process with you students. You can collect and measure the amount of gases produced from the electrolysis using inverted test tubes. You can also quantify the amount of charge moved during the electrolysis using a Voltage/Current Sensor.
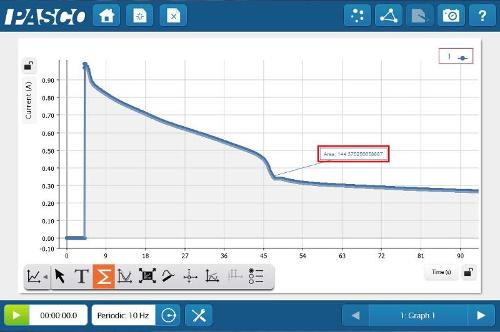
Using SPARKvue® software, a graph was created of Current vs. Time. After data collection was started, the power supply was connected. Data collection was stopped after the battery was disconnected.
Based on the volume, pressure and temperature of the gas collected, you and your students can determine the moles of Hydrogen or Oxygen produced. From the half reactions, the moles of gas can be stoichiometrically related to the moles of electrons.
The area under the curve in the Current vs. Time graph is equal to the total charge moved during the electrolysis. The ratio of the total charge (from the area under the curve), to the moles of electrons (from the gas collection), is equal to Faraday's constant, 96548 C/mol.

