Long Term Weather Monitoring
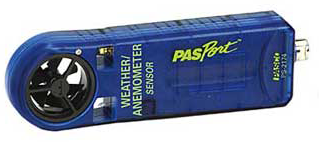
One great way to put data collection equipment to use during breaks or between labs is to conduct long term environmental monitoring. Students can analyze the data to address a variety of topics such as weather, microclimates, air/water quality, and biogeochemical cycles. Once students start to identify patterns in the data, they’ll start asking questions that can provide many teachable moments and lead to additional investigations. This example uses a Weather Sensor to collect data for several days.
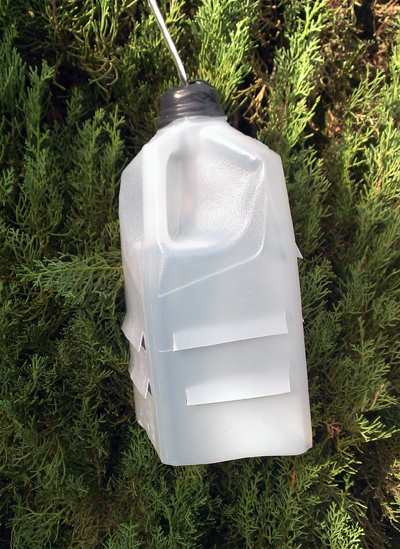
Before software setup, decide where to place the sensor. It’s important to consider what factors will effect your data and to make sure the equipment is protected. In this case the weather sensor was suspended out a window but placed inside a makeshift Stevenson Screen. The screen allows good airflow while protecting the sensor from rain. Students can easily make their own using 2L bottles, milk cartons, or other materials.
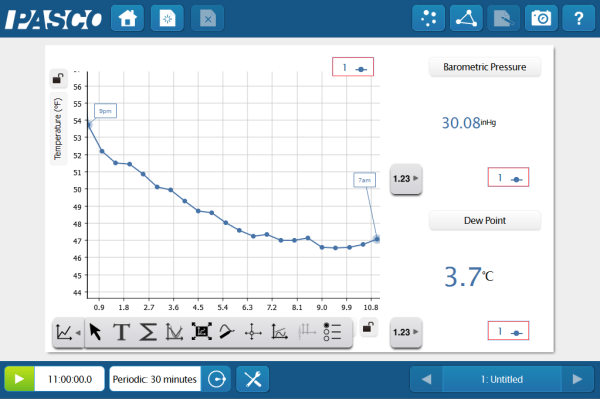
Once the sensor is placed, connect it to your interface and launch SPARKvue® or PASCO Capstone™. Build the page(s) to display the measurements of interest. Remember that regardless of what’s displayed, all available measurements are being logged and new displays can be created anytime.
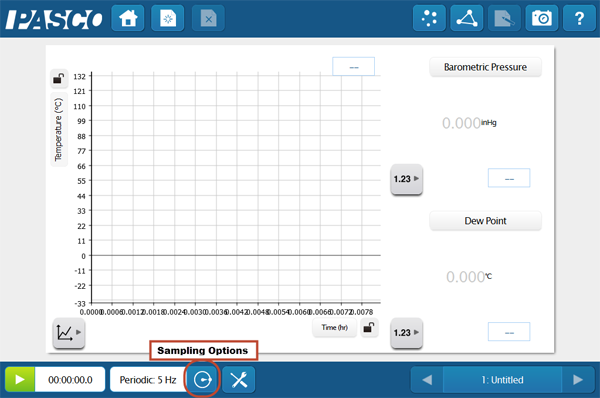
Next, open the sampling options. In this example SPARKvue is set to collect measurements every 30min for 72hrs. Most environmental science sensors can collect data as fast as once a second, or as slow as once every 4hrs.

While there are no software limitations to the amount of data that can be collected, big files can make analysis cumbersome, so it’s best to choose a sample rate that just fast enough to capture the changes you expect to observe. Once your sampling options are set, you can begin collecting data. Make a note of the start time/date because SPARKvue’s experimental clock does not log time/date with data. Data collection will automatically stop after 72hrs and can then be analyzed in SPARKvue or exported.