Collect Long-Term Data Remotely for Days, Weeks, or Months with Logging Mode
Whether they want to be scientists, teachers, engineers or entrepreneurs, preparing today's students for the future of work requires helping them learn how to source, manipulate and analyze long-term data. With Logging Mode, science classes can perform local, long-term data monitoring projects that make learning to use large data sets feel relevant to students.
What is Logging Mode?
Many of our Wireless Sensors include Logging Mode, an easy-to-use feature that allows educators to collect long-term data outdoors, while they continue meeting standards indoors. Logging mode automates the data collection process by logging data directly onto the sensor's memory, eliminating the need for time-consuming measurements, and ensuring that students have flexible opportunities to practice performing analyses with long-term data.
Logging Mode is most often used to perform lengthy experiments, such as tracking the local weather or measuring the primary productivity of an enclosed ecosystem, both of which are excellent real-world learning experience, but incredibly time consuming. For educators constrained by compacted lab times, Logging Mode can also be used to improve the time efficiency of short-term labs, so students have more time to analyze, discuss and develop those “big picture” connections.
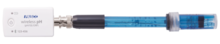
Long-Term Data Collection with the Wireless Temperature Sensor
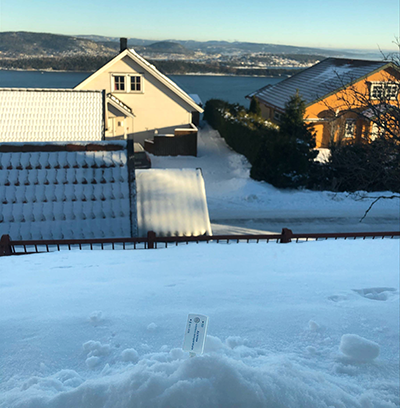
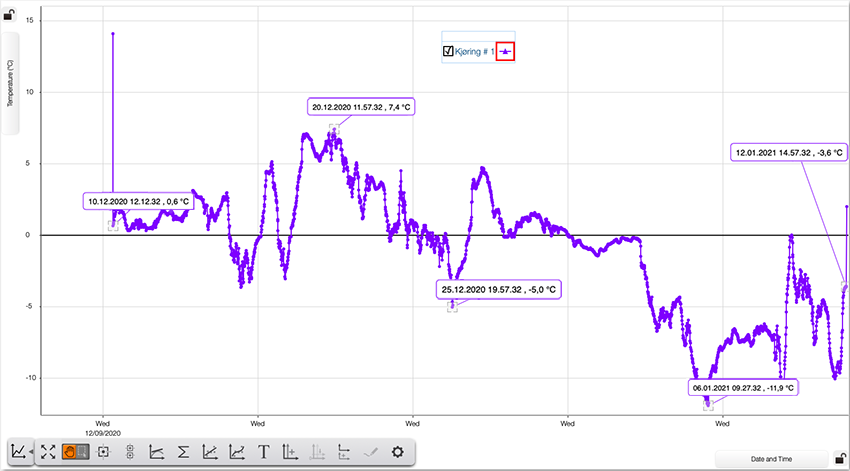
With a waterproof design and long-lasting battery, the Wireless Temperature Sensor makes a convenient tool for both short- and long-term data logging. Recently, our friends over at LabDidakt in Norway put the Wireless Temperature Sensor to the test by leaving it to withstand the Norwegian Winter for four weeks. Despite the snowy surroundings and temperatures that ranged from a sunny 7.4°C to a frigid -11.9°C, the Wireless Temperature Sensor did not disappoint! After four weeks in the cold, the sensor had lost just 25% of its charge and its onboard memory was still going strong. Take a look at their amazing results below.
Automating Short-Term Data Collection with Logging Mode
Our friends in Norway waited weeks to finalize their data collection, but you can use the Wireless Temperature Sensor to get similar results in a fraction of the time. Simply set up the experiment or environment you want to measure, connect the fully charged sensor to SPARKvue or Capstone, and set it to Logging Mode. Once the sensor is properly placed, determine how often you want the sensor to collect measurements, and click “Start” to begin collecting data. The sensor will continue logging data until it is turned off, allowing you to automate data collection for minutes, hours, days, or weeks. Logging Mode essentially breaks the typical experiment timeline into more manageable chunks, reducing the amount of time students spend on manual data collection, so they can jump right into what really matters: analyzing and discussing the phenomenon.
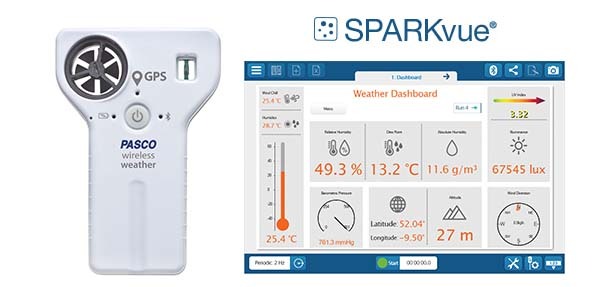
Collecting Long-Term Data with the Wireless Weather Sensor
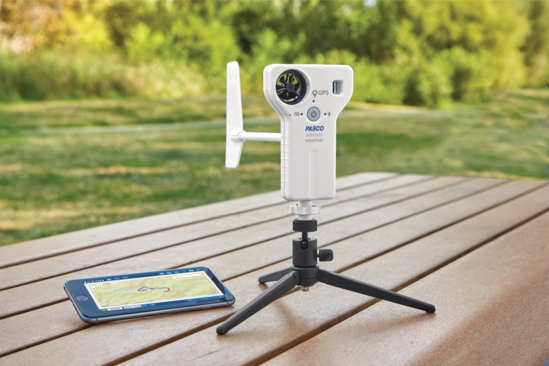
With nineteen different measurements and tools for GIS, it’s no wonder why educators love using the Wireless Weather Sensor for long-term environmental monitoring. Weather-proof, durable and easy to use, the Wireless Weather Sensor makes it possible for students to engage with long-term environmental data, without costing educators precious class time.
Perhaps the most advantageous part of performing long-term data collection, is that it allows educators to decide how and when they want their students to be involved in the experiment. Because there are so many measurements available, it can be helpful to involve students in the planning process by allowing them to discuss, debate and choose the parameters they consider most important for the intended purpose. Not only does this get them excited about the experiment, but it also helps students practice science in a way that mirrors real-life research.
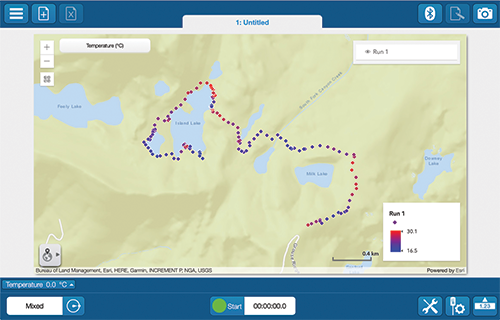
After charging the sensor and setting your parameters, simply set it outside to begin collecting data. This can be done with or without students, meaning you won’t have to sacrifice class time when you’re in a pinch. After retrieving the Wireless Weather Sensor, simply connect it to PASCO software to view the stored data. The complete data set can be easily shared with students to analyze, or it can be broken into smaller segments and assigned to groups as part of a project.
The low-cost Weather Vane Accessory allows you to download, view and analyze the data logged on a distant Weather Sensor at any time, without leaving the classroom. Especially useful for AP courses constrained by time, the Weather Vane Accessory makes it easy to incorporate local environmental data into your course on a daily, weekly, or monthly basis. Whether you’re studying seasonal changes, relationships between parameters, or comparing measurements between different locations, the Weather Vane Accessory enables students to quickly access the data they need, so they can focus on analysis, discussion, and drawing meaning from the investigation.
Data Logging with Other PASCO Wireless Sensors
Many of our Wireless Sensors include the Logging Mode feature. Some teacher favorites include:
- Wireless CO2 Sensor
- Wireless pH Sensor
- Wireless Oxygen Gas Sensor
- Wireless Light Sensor
- Wireless Sound Sensor
- Wireless Optical Dissolved Oxygen Sensor
There are many long-term experiments that can be explored using Logging Mode. Some popular examples include:
- Monitoring the oxygen production of an aquatic habitat during various seasons with the Wireless ODO Sensor. This activity can also be done using an inhabited fish tank.
- Monitoring the production of carbon dioxide in a closed system under various lighting conditions with the Wireless CO2 Sensor.
- Determining the Net Primary Productivity of an enclosed ecosystem using an EcoZone System, a Wireless CO2 Sensor, and/or a Wireless Oxygen Gas Sensor.
- Monitoring the acidity of soil before, during and after rainfall with a Wireless pH Sensor and a Flat pH Probe.
- Monitoring and comparing noise pollution over time with the Wireless Sound Sensor.
- Tracking light intensity and UV levels during an eclipse with the Wireless Light Sensor.