Exploring Physiology with SPARKvue® on the iPhone®
PASCO’s intuitive SPARKvue software is now available for phones, making it even more convenient for your students to explore the world around them.
Have you read the “Health Wise” column in NSTA’s January 2015 issue of The Science Teacher? Noise-induced hearing loss is occurring in almost 20% of today’s teens, and the likely culprit is listening to loud music for prolonged periods of time using earbuds or headphones.
Exposure to sounds above 85 decibels will cause hearing loss. Pediatrician Dr. Neil Izenberg, founder of KidsHealth.org, recommends that teachers instruct their students about this basic rule: “60 percent/60 minutes.” This means that students should limit their music-listening to a maximum of 60 minutes at any one time and at no more than 60% of maximum volume. The article provides a summary that explains how we hear. Essentially, hearing loss is caused by the death of sensory hair cells located within the cochlea. When damaged, these cells do not grow back (Bratsis, 2015).
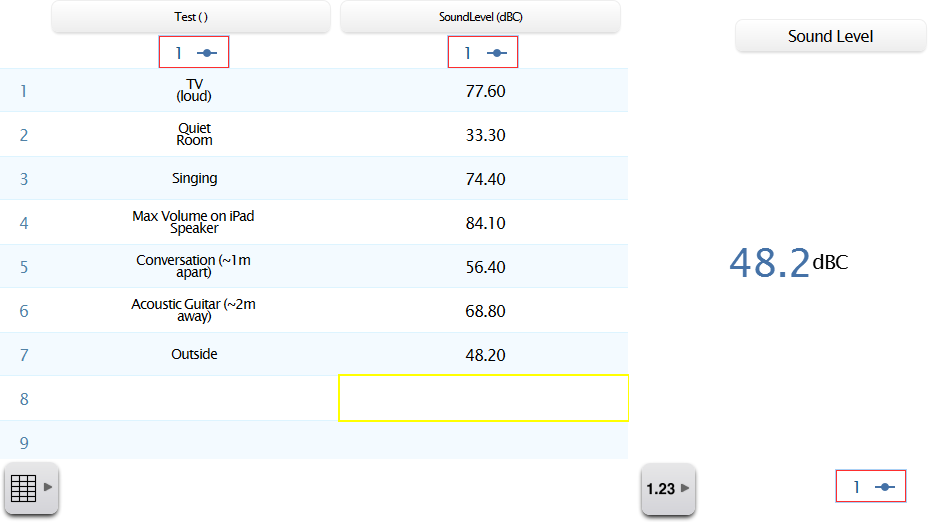
To help students gain a perspective on the sound levels in their environment, use PASCO’s SPARKvue to collect and analyze data from a phone’s onboard sound sensor. At school, students might explore the cafeteria during lunchtime, the gym during a basketball game, or the music room during band practice. Students can also record sound level data as they ride the school bus or when standing near a car as the engine starts. They can test sound levels that are produced by speakers when they listen to music, or when they play a musical instrument. Other activities that might be recorded include mowing the lawn, watching TV, or playing video games. Have students share their data and identify which instances were in the danger zone: above 85 decibels. Then they can brainstorm ways to reduce exposure to those dangerous noise levels.

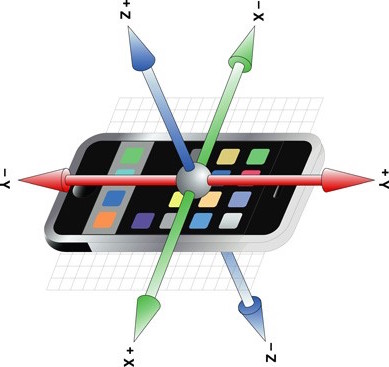
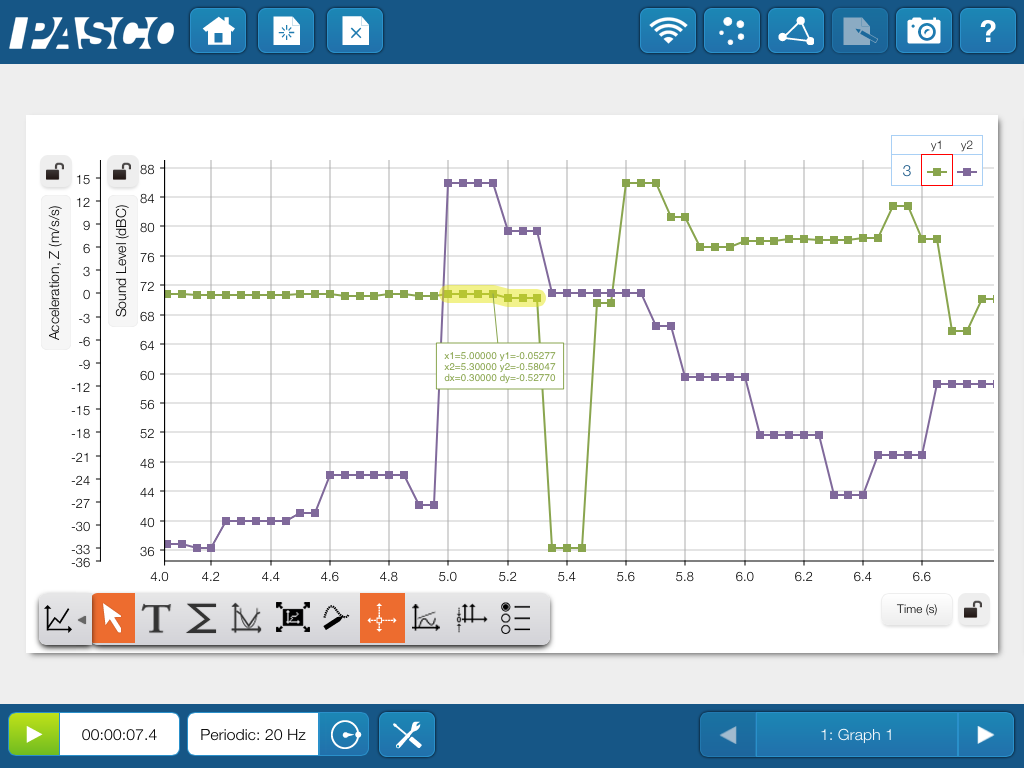
This activity can be used as an introduction to the anatomy and physiology of the human ear. To extend the activity further into a study of stimulus and response, students can also use their phones’ onboard accelerometers, which are visible as sensors in SPARKvue. By combining the microphone and accelerometer on their phones, students can detect a loud noise (e.g., from a whistle) and respond by raising a hand. Then they can calculate their reaction time by analyzing the graph. Students can create a graph of sound level and accelerometer data together vs. time. In this extension activity, the test subject holding the phone should stand with their back turned and about 20 meters away from the person with the whistle. Start by recording data, and when the subject hears the whistle, they should raise their hand.


Reference
Bratsis, M. E. “Pardon Me? Helping Students Avoid Noise-induced Hearing Loss.” The Science Teacher 82:1 (2015): 12-13. Print.
