
Enzyme Data-palooza
Many biology courses at every level start the year studying enzymes, since they are integral to so many biological processes. No matter what your preferred enzyme and substrate, sensors can help you get more data, and better data, faster. As you can see, we like to catalyze with catalase since it’s widely available (in nearly all living things) and easy to process for lab use. For example, using the Wireless Pressure Sensor with a simple yeast suspension and 3% H2O2, students can begin collecting data for under $100/station – and look at how much data can be produced!
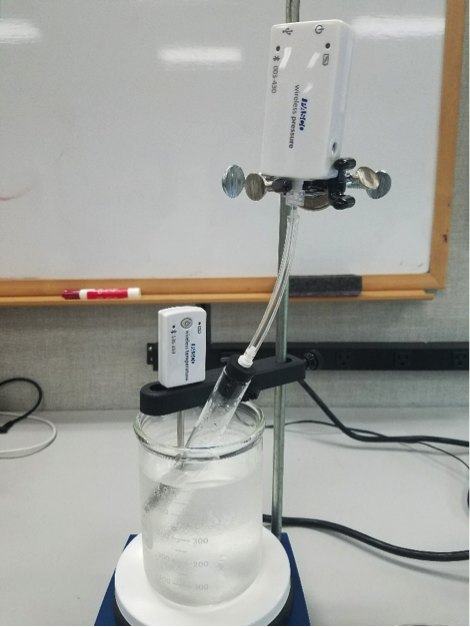
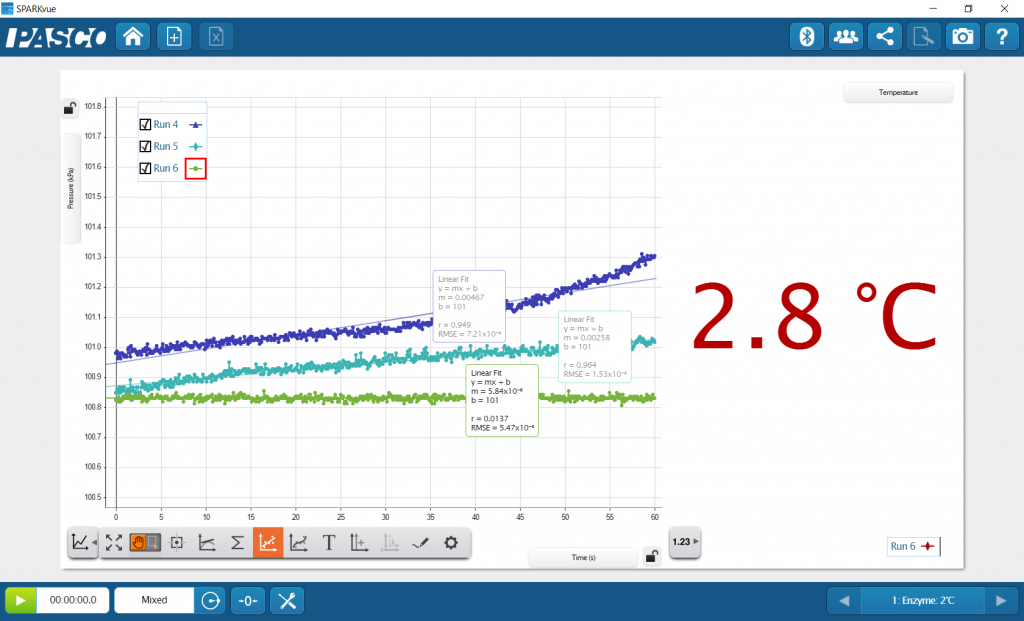
Table 1. Rate of Reaction for Yeast and Hydrogen Peroxide
| Condition | Trial 1 kPa/min) |
Trial 2 (kPa/min) |
Trial 3 (kPa/min) |
Average (kPa/min) |
|---|---|---|---|---|
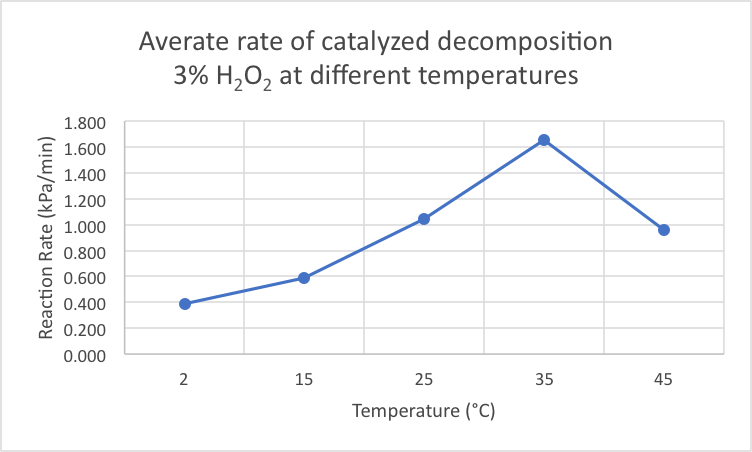
| 3°C | 0.280 | 0.155 | 0.733 | 0.389 |
| 15°C | 0.547 | 0.633 | 0.589 | 0.590 |
| 25°C | 0.981 | 1.015 | 1.134 | 1.043 |
| 35°C | 1.591 | 1.732 | 1.643 | 1.655 |
| 45°C | 1.045 | 0.941 | 0.899 | 0.962 |
With more data it’s possible to produce meaningful descriptive statistics with your students. This supports students’ math literacy and is useful to identify runs/groups that are outliers from the class data. While these outliers are often procedural errors, they can provide a useful springboard to inquiry. Ask students to determine why the group’s results differ. Are their results reproducible? If time allows, they can explore additional variables that can add to their understanding of protein structure, enzyme reactions, and even evolution.
The data above was produced using the Wireless Pressure Sensor. The protocol is the same with the Oxygen Gas Sensor; download the lab for your preferred approach.


