
Concentration and Colorimetry
Are your students struggling with the concept of concentration? Are they having trouble taking M1V1 = M2V2 beyond rote memorization to actual application? Try experimenting with colored solutions! The intensity of the color provides a great cue to help students visualize the concept, and the PASPORT Colorimeter allows students to quantify the activity.
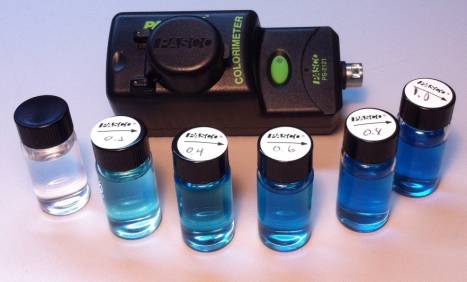
First, prepare a stock blue dye solution and label it “1.0 M”. Have students prepare different concentrations from the stock solution. Application of M1V1 = M2V2 is needed to complete the table and prepare the solutions.
| Concentration to be prepared (M) | Volume of 1.0 M stock solution (mL) | Volume of water (mL) | Total Volume of new solution (mL) |
|---|---|---|---|
| 0.0 | 0 | 10 | 10 |
| 0.2 | 10 | ||
| 0.4 | 10 | ||
| 0.6 | 10 | ||
| 0.8 | 10 | ||
| 1.0 | 10 | 0 | 10 |
From this point they can visually distinguish the concentrations of the solutions, and they will also be able to quantify this effect using the Colorimeter.
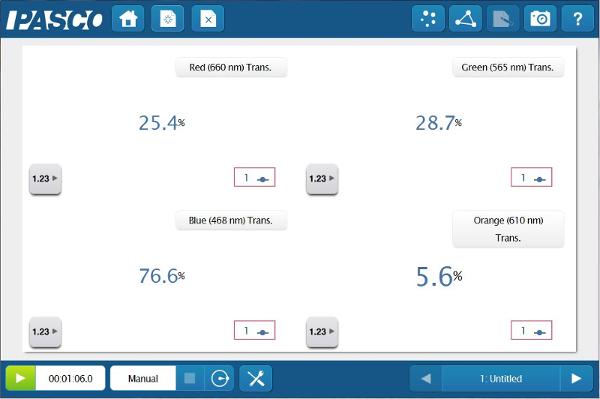
Because the Colorimeter can measure % Transmittance and Absorbance simultaneously at four wavelengths, the students will be able determine the relationship between the color of the solution that they see and the color of light that is affected by the solution.
Blank the Colorimeter by pressing the green button with distilled water in the cuvette, then create digits displays of all four wavelengths’ % Transmittance and Absorbance data. Change to manual sampling and insert the 1.0 M solution into the Colorimeter.
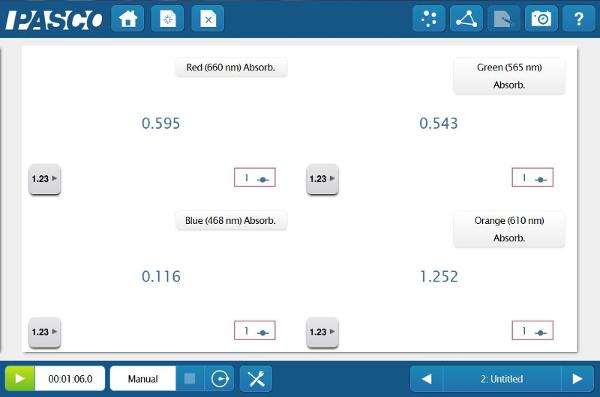
Now that the students have determined the best wavelength to study, they can start quantifying the different concentrations of the solution. But how do they know whether to look at Absorbance or % Transmittance? They can do both and compare!
Create a page with a table and a graph containing Concentration (x-axis) and Orange % Transmittance (y-axis). Now enter the concentrations of the solutions that you prepared. Once they are entered, place each cuvette in the Colorimeter and keep the value.
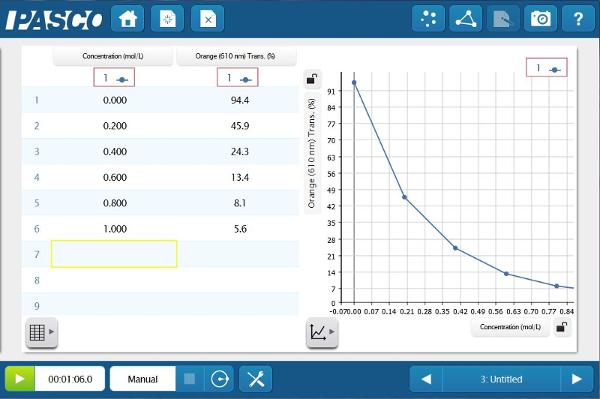
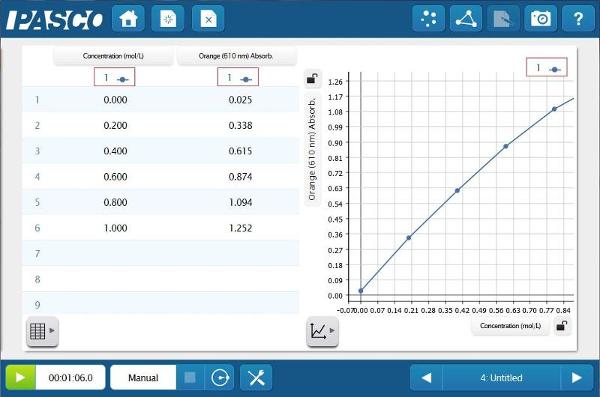
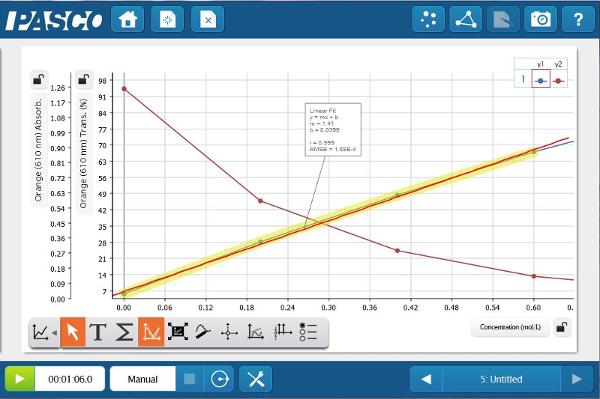
The Absorbance data provides a much straighter line. This relationship between absorbance and concentration is the basis of Beer’s law. Students can apply this newly constructed relationship, to determine the concentration of unknown blue solutions based on Absorbance data.
This simple activity with blue dye and a Colorimeter has provided your students with the opportunity to visualize and quantify concentration by seeing the differences in the solutions and measuring with the PASPORT Colorimeter. At the same time they are constructing some fundamental concepts of colorimetry/spectroscopy including how to select the appropriate wavelength and Beer’s Law.

