A Watershed Moment
Watersheds are an important natural feature. Whether they realize it or not, most people live near a watershed. In this activity, students can build a model watershed and observe the impact of upstream pollution.
A watershed is basically a large chunk of land where the water funnels downhill into a river. Based on what they know about watersheds, your students can design and build their own model with some common items. Your students shouldn’t make a mountain out of a molehill, but they will need to add some topographical features to their watershed. Some crumpled paper can provide the elevation.
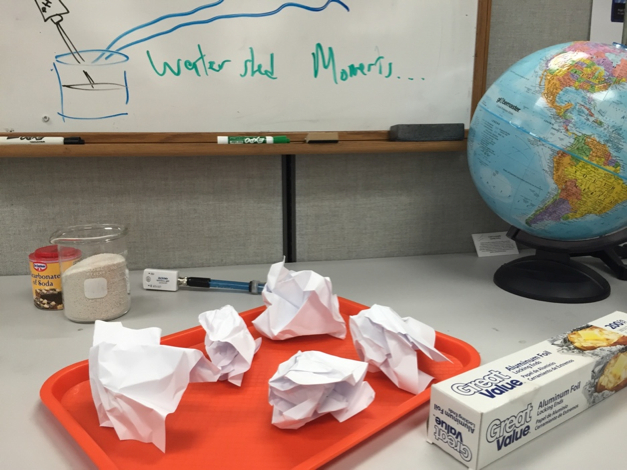
The paper landforms were covered with aluminum foil and a sandy bed was created to take me to the river.

The entire system was elevated so the runoff water could be collected into a container for testing.
Now it was time to put the water into this watershed. No need to cry me a river, I simply poured some water onto the highest peak of my model to simulate the melting of snow and ice. I continued to slowly pour water until the runoff reached the collecting container where I could test the pH.

Getting the baseline measurement is a good time to remind students that this runoff could represent the freshwater source for a community or a town.
What would happen if a pollutant was added? We can visually model the effects of negative human activity with some food coloring and quantitatively measure the effects with some vinegar*. I added two drops of food coloring and a couple of milliliters of vinegar near the top of the model in the path of the flow of water.
*Pollutant solution note - I used vinegar because the pH was already high based on the water I was using. If the pH was initially low, I would have planted small amounts of baking soda around the valley.
Finally, I added some water and started watching the river flow.

There was no smoke on the water, but the runoff was definitely “polluted” by the blue dye. What happened to the pH? We can look at the data to find out!

Not only was there a drop in pH, we can actually see the moment when the pollution reached the collection vessel.
This engaging activity can not only help students model and understand their natural resources, it can be a great way to start a discussion about the impacts of human activity. Hopefully this watershed activity can turn into a watershed moment.
Free Downloads:
Here are a handout and PowerPoint presentation that have been used when performing this activity as part of a PASCO workshop.