Product Summary
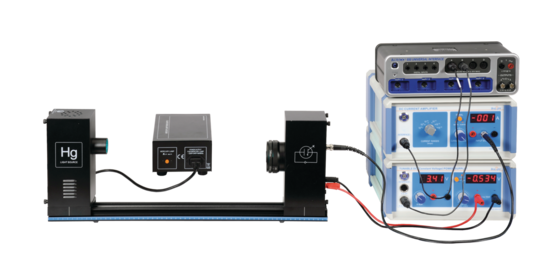
The Photoelectric Effect System is used to perform the photoelectric experiment, determining Planck’s Constant to within 5%. This apparatus uses the conventional method of determining Planck’s Constant. The metal plate in the photodiode is illuminated with various frequencies of light, selected from a mercury lamp using filters. The voltage is then adjusted to stop the photoelectric current. The stopping voltage is plotted vs. the frequency, and Planck’s Constant is determined from the slope of the graph.
The concept that the stopping voltage does not change with light intensity is tested using the various apertures that change the light intensity by partially blocking the light.
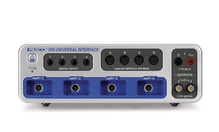
Use the 850 Universal Interface and PASCO Capstone to collect and analyze data.
Both the picoammeter and the power supply for the stopping voltage have sensor ports on the front that connect to the analog sensor ports of the 850 Universal Interface. PASCO Capstone automatically recognizes these instruments and can read the current and the voltage. During the experiment, each time a different filter is applied, the user clicks “Keep” in PASCO Capstone and the value of the stopping voltage for that frequency is recorded and automatically graphed vs. frequency.
Concepts
- Connects to the 850 Universal Interface for data collection in PASCO Capstone
- Find Planck’s Constant to within 5%
- Verify that stopping voltage is independent of intensity
- Find characteristics of the photodiode
What's Included
Data Collection Software
This product requires PASCO software for data collection and analysis. We recommend the following option(s). For more information on which is right for your classroom, see our Software Comparison: SPARKvue vs. Capstone »
Interface Required
This product requires a PASCO Interface to connect to your computer or device. We recommend the following option(s). For a breakdown of features, capabilities, and additional options, see our Interface Comparison Guide »
Experiments
Experiment Library
Perform the following experiments and more with the Photoelectric Effect Experiment.
Visit PASCO's Experiment Library to view more activities.
College / Physics
The photoelectric effect is the emission of electrons from the surface of a metal when electromagnetic radiation (such as visible or ultraviolet light) shines on the metal. In this lab, you will study the effect varying the light...